

Starting in July 2016, dealers and portfolio advisors will be required to report investment performance to their clients. The money-weighted rate of return (MWRR) was chosen by the Canadian Securities Administrators (CSA) as the industry standard for these performance calculations. Although the MWRR is arguably more relevant to the individual investor (as it can reward or penalize investors for the timing of their cash flows), it is considered by most advisors to be inadequate for benchmarking purposes. This is because the timing of the investor’s cash flows (which most advisors have little to no control over) can cause the performance to be over or understated, relative to the time-weighted rate of return (TWRR).
The money-weighted rate of return can be thought of as the rate of return, r, which equates the right hand side of the following equation to the ending portfolio value, V1.
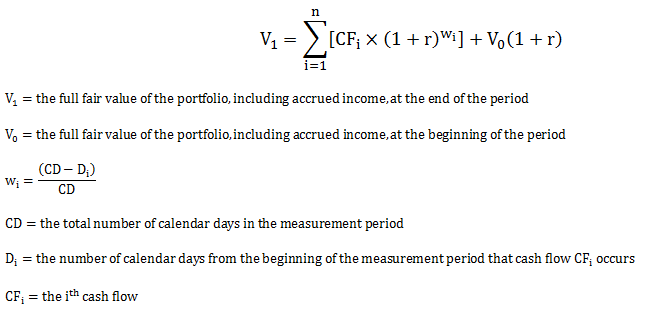
Source: CFA Institute
This method can be useful for calculating the rate of return when there have been only small external cash flows during the measurement period, relative to the size of the portfolio. It may also be the only available option for investors who do not have access to daily or month-end portfolio values (I often come across investors who receive quarterly statements, as opposed to monthly).
As the MWRR assumes all cash flows receive the same rate of return while invested, its return can differ substantially from the time-weighted rate of return (TWRR) when large cash flows occur during periods of significantly fluctuating portfolio values. This makes the MWRR less ideal for benchmarking portfolio managers or strategies than the TWRR. For example:
- When a large contribution is made prior to a period of relatively good (bad) performance, the money-weighted rate of return (MWRR) will overstate (understate) a portfolio’s performance, relative to the time-weighted rate of return (TWRR).
- When a large withdrawal is made prior to a period of relatively good (bad) performance, the money-weighted rate of return (MWRR) will understate (overstate) a portfolio’s performance, relative to the time-weighted rate of return (TWRR).
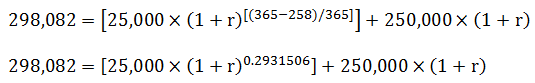
Without the help of computers, the calculation is just a series of trials and errors. Using the above equation and the values from our original example, Investor 1 would begin by plugging in return “guesses” for r until the right-hand side of the equation equals the ending portfolio value, V1. They would eventually stumble across 8.98% as the plug return that equates the right-hand side of the equation to 298,082 (or as close as possible).
Example: Manual MWRR calculation for Investor 1
| r “guess” | Right-hand side of the equation: |
| 10.00% |
300,708 |
| 9.00% |
298,140 |
| 8.99% |
298,114 |
| 8.98% |
298,088 |
| 8.97% |
298,063 |
An easier way for investors to calculate their MWRR would be to download the Money-Weighted Rate of Return Calculator, available in the Calculators section of the Canadian Portfolio Manager Blog. This calculator requires minimal inputs and is fairly intuitive to use. It also annualizes (averages) returns over periods longer than a year.
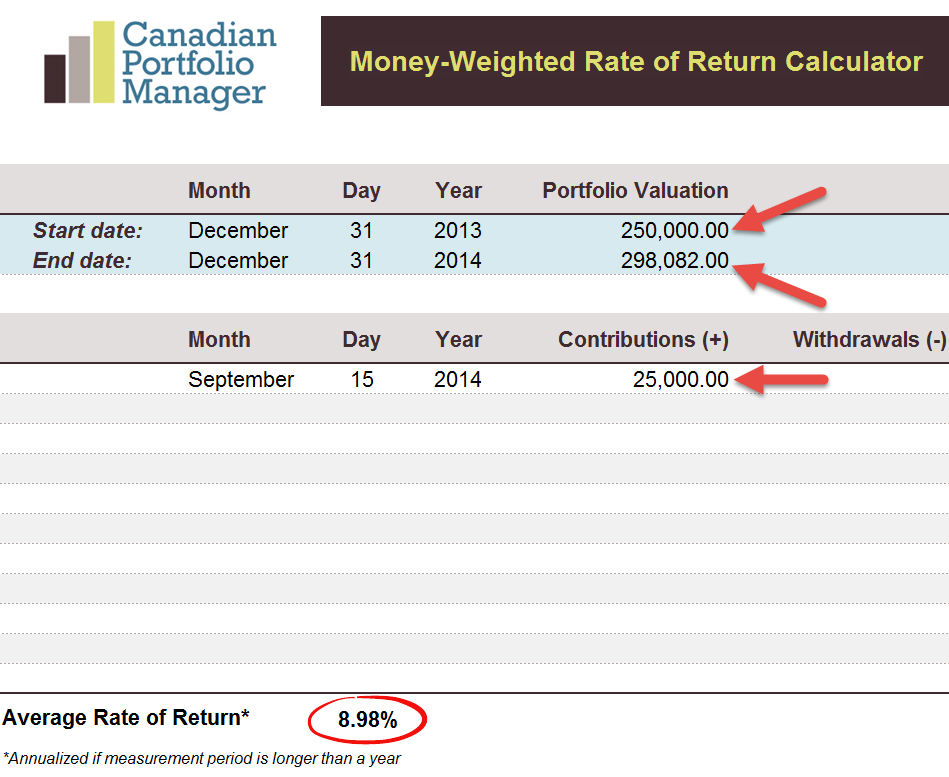
After downloading the Excel spreadsheet, select the start and end dates for your measurement period, entering the total portfolio value to the right of each date. Next, enter the dates and amounts of any portfolio contributions (+) or withdrawals (-) during the measurement period. I’ve included examples for both investors below.
Money-Weighted Rate of Return (MWRR): Investor 1
Money-Weighted Rate of Return (MWRR): Investor 2
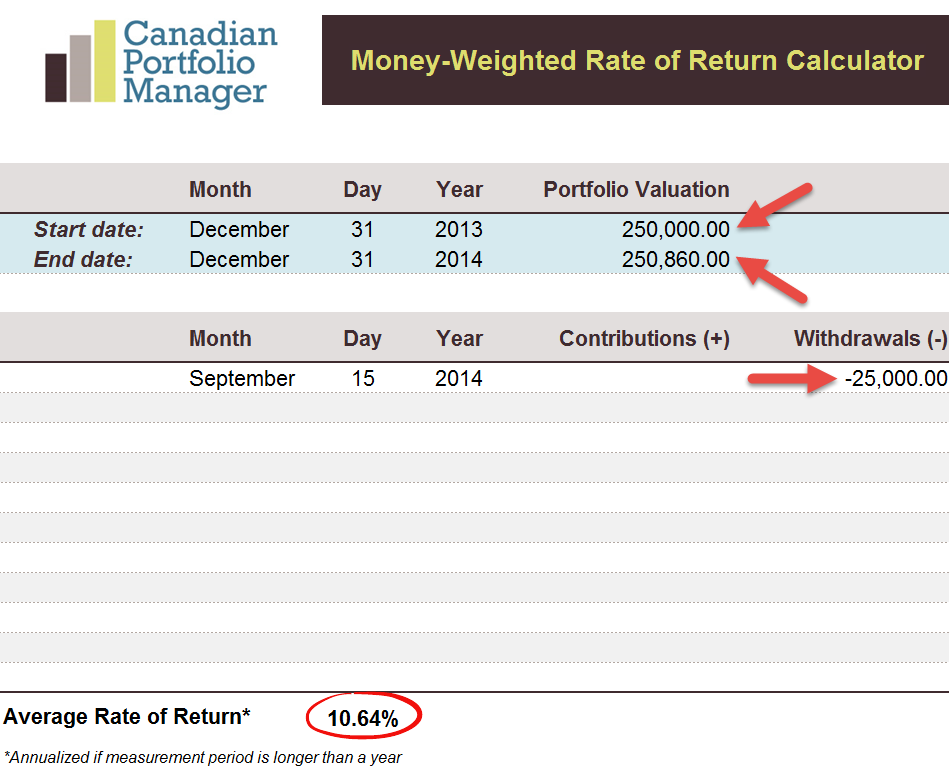
The MWRR results are noticeably different than the TWRR results from our first example. Investor 1 contributed $25,000 to their portfolio before a period of underperformance (-5.56% versus +16.25%) and ended up with a significantly lower MWRR of 8.98%. On the other hand, Investor 2 withdrew $25,000 from their portfolio before a period of underperformance, which resulted in a significantly higher MWRR of 10.64%. This makes intuitive sense; Investor 1 made a bad timing decision by adding funds right before the markets went down, while Investor 2 made a good timing decision by withdrawing funds right before the markets went down.
Performance Results
| Methodology | Investor 1 | Investor 2 |
| Time-Weighted Rate of Return (TWRR) | 9.79% | 9.79% |
| Money-Weighted Rate of Return (MWRR) | 8.98% | 10.64% |
Each investor’s cash flow decision resulted in a higher or lower MWRR, relative to the TWRR. Their investment strategy was exactly the same in each case (i.e. to track the MSCI Canada IMI Index). By comparing their MWRR to an index return, both investors may incorrectly conclude that their portfolio manager has underperformed or outperformed the benchmark (which is why a money-weighted rate of return should not be used for benchmarking purposes).
Next up, we will examine the Modified Dietz Rate of Return.
Hi Justin,
When I used XIRR function to calculate the year to date MWRR (from 01/01/2021 to 05/31/2021), the result was so much different from the amount in my statement. Do you know why this happened. Can you advise how to calculate the return properly?
Thanks very much!
@Hayley – I believe the XIRR function is annualizing your return, as it is less than a year. You should calculate your rate of return over periods greater than 1 year.
Hi Justin
Could you please provide some clarity in calculating money weighted return with excel XIIR function.
For instance if I have n number of cash flows in a year and in order to know the yearly return (growth) of a portfolio can I calculate XIRR from 31-12-2018 to 31-12-2019 & from 31-12-2019 to 31-12-2020 individually and then geometrically chain those two return to know the average annual return? Would it be the correct way of calculating returns?
As the geometrically chained annual XIIR of two years and the XIIR return from 31-3-2018 to 31-3-2020 is quite different. Which method of calculation is correct? In order to ensure accuracy could you please provide your assistance.
Moreover could please share a link of your money weighted calculator. It would be grateful.
Kind Regards
Harsh
@Harsh: You would generally use the XIRR function in excel across multiple years without chain-linking the annual returns (to obtain the MWRR). If you chain-link them annually (or monthly), the returns will begin to resemble a time-weighted return.
If you link the monthly returns, it technically becomes a new type of return methodology, called the “Linked Internal Rate of Return” (LIRR). This will closely resemble a Modified Dietz return.
I no longer have a MWRR calculator, but you can just follow these instructions in excel:
https://support.office.com/en-ie/article/xirr-function-de1242ec-6477-445b-b11b-a303ad9adc9d
Hello.
How to calculate Money-weighted Rate of Return when Excel XIRR function give no unique answer (the answer change by changing guess item)as a result of multiple changes of sign in the sequence of cash flows?
Hi, did i miss the MWRR calculator? It seems to be missing from the calculator page now.
@Scott: I took it down because it kept having formula issues. I may post a new version in the future.
The calculator is really just the XIRR function in excel – here’s a handy tutorial:
https://support.office.com/en-ie/article/xirr-function-de1242ec-6477-445b-b11b-a303ad9adc9d
Hi Justin,
I wonder if you could help me to calculate the MWRR based on the following data:
evaluation period: 11/04/2017 – 13/03/2019
$ 30,233.20 invested at the beginning of the evaluation period as a lump sum into a portfolio of income paying mutual funds.
$ 29,280 is the value of the portfolio of income paying mutual funds at the end of the valuation period.
$ 663.20 paid in charges during the evaluation period.
$ 1,978 total income paid out by the income paying mutual funds during the evaluation period.
Essentially, because all the sums are aggregated and I only know the beginning and end dates of the evaluation period and I do not know the exact timing of each cash flow, I am struggling to get any MWRR, if indeed is possible to get one? If not, should I just use the standard Holding Period Return as a measure of the portfolio performance?
Thanks for taking the time to look into it
Regards
Max
@Max: If all of the income from the mutual funds was reinvested (i.e. the $29,280 figure includes all of the income), then your beginning value is $30,233.20 and your ending value is $29,280 (you can ignore expenses, as these would decrease the ending value of the portfolio, so they are already accounted for). Based on these figures, XIRR = -1.65% annualized.
If the $1,978 was paid out in cash, then you would add this cash amount to your ending mutual fund value (i.e. $29,280 + $1,978 = $31,258). Based on these figures, XIRR = +1.75% annualized.
Here’s a straight-forward article on how to calculate your MWRR using excel: https://www.whitecoatinvestor.com/how-to-calculate-your-return-the-excel-xirr-function/
Further to my comment, if the start value of the portfolio is 0, then you get ARR of 0.0% It seems to me that this should be accepted and then in the cash flow sections you build up the portfolio with contributions and withdrawals.
But since the sheet is locked down, one cannot fix the issue.
Can you please help out Justin?
@Tim: Just enter your first contribution amount/date as the start value/date.
Sorry, but this calculator does not appear to work. I get 0.0% after entering information.
Is there any way to add additional lines to the calculator if I want to track over several years and have monthly contributions?
I am getting a 0.00 value in the average rate of return.
Are you able t o send me an updated copy of the spreadsheet?
@Amanda Bishop: It should be working fine – please feel free to send your completed spreadsheet and I’ll take a quick look: jbender@pwlcapital.com
Hi,
I tried to use XIRR function but I got a different result than your provided excel calculator. This is what I enter in column A for the date (using DATE function) and amount on column B:
DATE(2017,4,12) 500
DATE(2017,12,11) 17.7
DATE(2017,12,18) 17.7
DATE(2017,12,25) 17.7
DATE(2018,1,1) 22.5
DATE(2018,1,4) -592.22
on column C1, I put this as formula: =XIRR(B4:B9,A4:A9) and I got 4.5 and your calculator return 3.3.
Just wondering what did I do wrong here?
Thanks
@Chuong: As your measurement period is less than 1 year, your manual calculation of 4.54% is annualizing the return (which is arguably not accurate). My calculator’s 3.30% is the “year-to-date” performance, so it is measuring only what has actually occurred.
Hi Justin,
I use your MWRR calculator very often.
It would be possible learn that formulation to work in my private Excel document?
I would like to use the MWRR formule in it.
Thank you and congratulations. I think it is a good and easy to use tool.
@Jordi Chavanel: The MWRR calculator simply uses the XIRR function in Microsoft Excel: https://support.office.com/en-us/article/XIRR-function-de1242ec-6477-445b-b11b-a303ad9adc9d
Good luck!
I had the same error with trying to the MWRR. It wouldn’t be anything except 0.00%
@James: Have you tried the calculator recently? (I had updated it over the past month as there was an error in one of the cells).
If you’re still receiving a 0% output, please feel free to email your spreadsheet and I’ll take a look.
I downloaded the spreadsheet, but the average rate of return cell appears to have no formula — in other words, the return always stays at 0.0%. What am I missing? Thanks!
@Robert M: Very strange – I’ll update the spreadsheet and email you a copy. Please let me know if the updated version works.
Question for this, let say there’s a dividend payout. How should we calculate ? thanks
@Janet: There’s no need to include dividend payouts – these are included in the market value of the portfolio.
@Chis: Purchases and sales of securities do not need to be entered into the calculator.