
A number of readers have asked me what I think about Paul Merriman’s Ultimate Buy-and-Hold Portfolio. It sure does have a nice ring to it (placing the word “ultimate” before anything tends to have that effect). Merriman believes that you can increase the expected return of a simple Couch Potato portfolio by adding more small-cap and value companies to the mix. This is not a new idea – for decades now, academics have known about the historical small-cap and value premiums. Notable fund companies, like Dimensional Fund Advisors (DFA), have even created products based on their research.
Although Merriman’s articles are written from a US perspective, we can take his concepts and apply a Canadian spin to them. First, let’s take a look at a balanced Couch Potato portfolio (similar to my 40FI-60EQ model ETF portfolio). You can see that the equity mix is made up of 20% Canadian stocks, 20% US stocks, 16% international stocks and 4% emerging markets stocks.
Couch Potato Balanced Portfolio
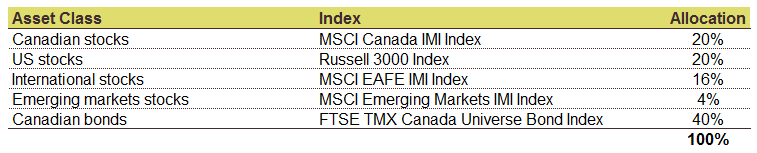
Portfolios are rebalanced annually
We’ll then divide each equity region into four equal parts, consisting of large-cap blend, large-cap value, small-cap blend and small-cap value companies. Merriman usually includes real estate investment trusts (REITs) in his model portfolios as well, but I’ve excluded them so that we can view the small-cap and value effects in isolation).
Paul Merriman Balanced Portfolio
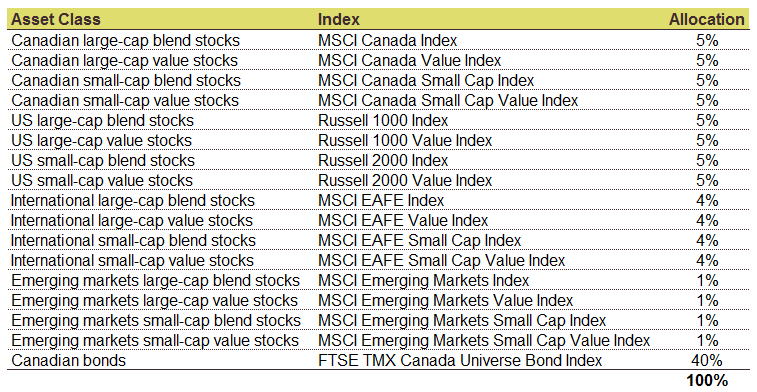
Source: Adapted by PWL on August 10, 2016 from http://paulmerriman.com/ultimate-buy-hold-strategy-2016/
Portfolios are rebalanced annually
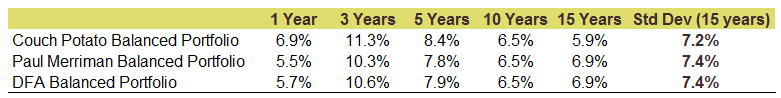
Comparing the performance of the two portfolios, we find that the Couch Potato portfolio has outperformed the Merriman portfolio over the 1, 3 and 5 year periods ending December 31, 2015. Both portfolios performed similarly over 10 years. The Merriman portfolio started to shine after 15 years, beating the Couch Potato portfolio on average by about 1% each year.
Portfolio Performance: January 2001 to December 2015
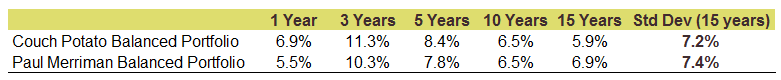
Sources: MSCI Indices, FTSE TMX and Russell indices courtesy of Dimensional Returns 2.0
There are a few insights that can be gained from this example. First, 15 years is a long time to wait for higher expected returns (with absolutely no guarantee of higher returns than the index). There is a huge behavioural argument against straying from the index for any active strategy.
Second, Merriman’s portfolio is much more complex than the Couch Potato portfolio. It contains 12 additional holdings, which must be managed as new cash is added to the portfolio and rebalancing opportunities arise. ETFs that have a similar value and small-cap tilt may not even be available to DIY investors.
Third, these figures are before any fees or taxes. If Merriman’s portfolio could be theoretically constructed using readily available ETFs, the ongoing costs would likely be higher than a Couch Potato portfolio.
What if I still want to invest like Paul Merriman?
For DIY investors, I always recommend keeping things simple and sticking with a Couch Potato portfolio. Trying to piece together the necessary ETF parts like a mad scientist could result in a portfolio abomination. Much like Victor Frankenstein, you may end up abandoning your monster shortly after its creation.
If you have an advisor that has access to DFA funds, there is a relatively easy way to create a Paul Merriman portfolio. For each equity region, simply have your advisor mix about 1 part broad-market ETFs with 2 parts DFA Vector Funds – by doing this, you’ll end up with a decent Merriman clone. I’ve included the weights of the indices below – you’ll notice these are very similar to the model DFA portfolios that some of our clients invest in.
DFA Balanced Portfolio
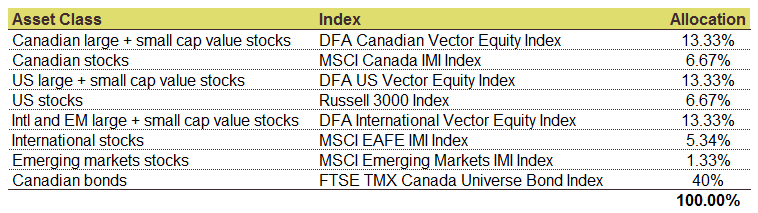
Portfolios are rebalanced annually
The DFA portfolio performance below is nearly identical to the Merriman portfolio performance. I’ve also included an additional graph showing the growth of $1 for each of the portfolios. The blue line representing the DFA portfolio is barely distinguishable from the brown line representing the Merriman portfolio.
Portfolio Performance: January 2001 to December 2015
Sources: MSCI Indices, DFA, FTSE TMX and Russell indices courtesy of Dimensional Returns 2.0
Growth of $1: January 2001 to December 2015
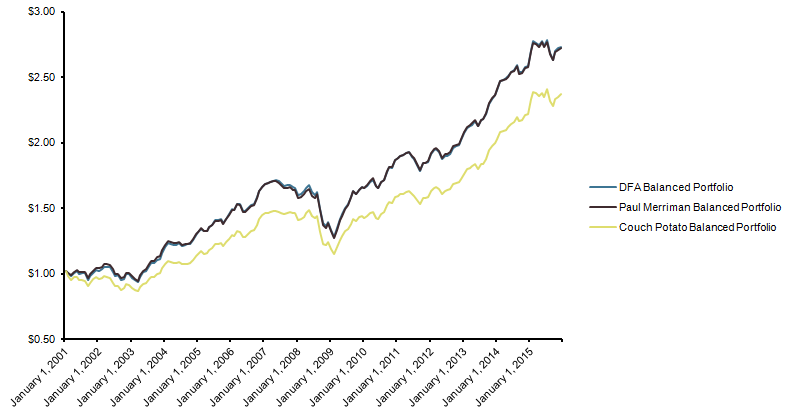
Sources: MSCI Indices, DFA, FTSE TMX and Russell indices courtesy of Dimensional Returns 2.0
ccp etf model use zag as the party of the bond. I wonder why not use vab which mer is 0.13%, but zag’mer is 0.23%
@peter: Although ZAG’s published MER on BMO’s site is 0.23%, they have recently reduced ZAG’s fees. Going forward, the MER is likely to be about 0.10%. Please feel free to substitute VAB for ZAG, as I have mentioned in the following blog post: https://www.canadianportfoliomanagerblog.com/how-to-build-an-etf-portfolio/
Long time readers of CCP will remember the Über–Tuber model portfolio. It added a small cap weight. (It was inspired by the Fama-French research that value stocks and small-cap stocks have historically delivered higher returns than the overall market.) Further info can be found on the internet archive, with the last content at https://web.archive.org/web/20141207100649/http://canadiancouchpotato.com/model-portfolios.
Hey Justin I am 37 years old and have a defined pension with omers through my work, was wondering what asset allocation makes sense for me in a TFSA for stocks and bonds.
@Nick: Unfortunately, I’m unable to provide specific investment advice without a thorough understanding of an investor’s situation.
Thanks Justin – great article. I have one of those Frankenfolios you so eloquently described. In fact, I usually put on a lab coat and safety goggles when it’s time to rebalance. Would you ever recommend liquidating and starting over with something more manageable? They’re all low-cost ETFs, but I know a few of them could be swapped out for even lower-MER products.
Thanks,
Chris
@Chris D: It would depend if there are substantial capital gains taxes that would be payable upon liquidation. If you could do it fairly efficiently, it would likely make your rebalancing life much easier.
Or you could consider buying the same securities in your spouse’s accounts to create a Bride of Frankenfolio ;)
Thanks for the quick reply Justin. Sadly the Bride of Frankenfolio is alive and well. A family of monsters across four registered accounts. Everything we have is registered, so capital gains are non-existent. I’ve always just found it hard to get my head around selling one ETF and turning around and buying essentially the same product. I guess it’s just the cost of the transaction, which is about $9 per trade in my case.
Capital gains aside, are there any other hidden costs / pitfalls involved in killing these monsters?
Chris
@Chris D: Just watch out for currency conversion costs (if they’re US-listed ETFs) and bid-ask spreads (if they’re relatively illiquid ETFs) – as always, try to use limit orders if possible. Good luck!
Hi Justin,
I love the blog – it’s very informative and I’ve learned a lot from it. Something I haven’t seen you explain yet and I’m curious about is your thoughts about the fund weightings in your model portfolios. I’ve noticed you weight the equity portion of your model portfolios with 33% canadian, 33% USA, and the final 33% between international and emerging markets. Since Canada only makes up about 5% of global market cap, the USA about 50%, and international and emerging about 45%, would it not make sense to weight the equity positions accordingly? The idea behind this is that it is a more pure passive approach that avoids home country bias and reflects the global market expecations. Additionally, since the Canadian market is heavy in financial and resource stocks, overweighting Canadian equity decreases sector diversification. I’m wondering if your recommendation has to do with fees & expenses, a rebalancing strategy, simplicity, or some other reasons?
Thank you,
John
@John: I’m glad you’ve been enjoying the blog – thanks for reading! Unfortunately, it is impossible to know in advance what the optimal allocation to global equities is. A great resource on the subject is this Vanguard paper: https://www.vanguardcanada.ca/documents/global-equities-tlor.pdf
I wouldn’t argue with an investor who wanted to have a market cap equity weight – I’ve noticed in the past that this can be hard to stomach from investors when Canada is outperforming global stocks (like in 2016). From my experience working with clients, a 1/3 equity allocation to Canada seems to be a decent starting point for discussion.
What about the new ETF from Vanguard Canada, Global Momentum Factor ETF (VMO) ? Could it be used to replace some DFA funds ? Where do he fit in this strategy ?
@LawrenceW: DFA does not specifically target momentum as one of their factors (they instead employ momentum screens to their targeted stocks). So VMO is not expected to be a suitable alternative to DFA funds.
Sorry Justin, i was refering the Vanguard Global Value Factor ETF (VVL) and not VMO !
@LawrenceW: The Vanguard Global Value Factor ETF (VVL) will likely only tilt towards a single factor (value companies). DFA tilts towards smaller companies, value companies, profitable companies, and also uses momentum screens (so Vanguard’s strategy will likely differ from DFA’s). As VVL is actively managed (and Vanguard has not provided any back-tested performance data), I unfortunately cannot even run a regression analysis to view the expected factor tilts.
Hi Justin,
What do you think of Ishare FactorSelect ETFs :
http://www.investmentexecutive.com/-/blackrock-adds-five-new-etfs-to-smart-beta-family
Would this be a good alternative for DIY investors who want to replicate DFA funds ?
@Jaz: I’m working on a blog post about the iShares Edge Multifactor ETFs – stay tuned!
Thank you for another great article Justin.
Is it common to apply statistics to a comparison like this? Specifically, I am curious about the likelihood of the Merriman outperformance being due to chance.
Thank you,
Steve
@Steve: The Merriman outperformance was due to the addition of small cap and value companies to the mix, over the 15-year measurement period studied. If you run 3-factor regressions on the equity portions, you will likely see significant t-stats for the value and small-cap coefficients (above 2). Unfortunately, this does not give us any meaningful information about what the premiums will be going forward.
Thanks Justin,
For many of us DIY investors that are still comfortable doing so, what alternatives to DFA funds exist? Are there not ETFs that are designed to capture what the DFA funds do? The cost of hiring an advisor to simply access the additional returns that adding DFA to a portion of the overall portfolio seems in contrary to the very premise of Coach Potato investing.
Kulvir
@Kulvir: I would agree that hiring an advisor for the sole purpose of accessing DFA funds does not make a lot of sense (if their only value proposition is that they offer DFA funds, I would be skeptical). I would also be lying to you if I said there were great ETFs that are perfect substitutes for DFA (there are not many non-US equity ETFs that would fit the description). For now, I would still recommend that DIY investors stick to broad-market ETFs.
Hi Justin, thanks so much for writing this article and doing the research behind it. It addresses exactly what’s been on my mind.
Kulvir already asked, and you answered, the main question I was going to ask. With ETF offerings growing in Canada I imagine if this same question was asked in the not-too-distant-future there may be viable options that allow a DIY investor to obtain a value and small-cap investment bias. As a person with your ear to the ground when it comes to new ETF offerings, it would be fantastic if you could revisit this periodically via an update if anything interest comes along!
While you make a good point that 15 years is already a long time; using even-longer historical data (Paul Merriman uses 46 years) seems to show a greater annual performance gap; and of course if that’s the case the “growth of $1” chart would show a far more substantial gap between the couch and the DFA/Merriman endpoints if run over a longer period of time. For me, that’s the most compelling reason I can’t seem to let go of trying to find an affordable Canadian investor optimized way model the portfolio.
@Will H: I’ll see what I can throw together over the next week to show investors how to view different “smart beta” products – it will require digging into the dreaded 3 factor regressions.
I would take Paul Merriman’s data with a grain of salt. Many of the indices do not go back the entire period (i.e. Intl Large-Cap Value: 01/1975, Intl Small-Cap Value: 07/1981, etc.). The international data is also likely using Dimensional’s International Small Cap Value Indices, which also add profitability screens (in addition to small cap and value sorts).
Another good article from Justin. I had DFA funds through an adviser in Ottawa. I like the DIY method with CPM/CPP & MoneySense recommendations.
@Marko: Glad you liked the article. I tend to agree that DIY investors are better off using a version of the model ETF portfolios that Dan or myself publish (making minor adjustments where appropriate to improve the tax-efficiency of the portfolio).
@Justin: TD e-series and Tangerine funds have less than 0.15% allocated to emerging markets. That’s why I am asking my question.
@Sebastien: The performance figures from this particular blog post are before fees. The TD e-Series and Tangerine fund performance that I compiled is after-fees (so this is causing some of the difference in returns). The other differences could be due to slight index differences or the exclusion of emerging markets.
Interesting article. As the latest CCP portfolio from Dan exclude emerging markets, does the performance is better than the one you used for this post? Just curious to know.
@Sebastien St-Gelais: The latest 3-ETF CCP portfolio does include emerging markets (there is currently about 3.8% allocated to emerging markets in a 60% equity, 40% fixed income portfolio). This is similar to the 4% allocation to emerging markets stocks in these examples. For reference, the Vanguard FTSE Global All Cap ex Canada Index ETF (VXC) allocates about 54% to US stocks, 36.5% to international stocks, and 9.5% to emerging markets.