
I used to be a renegade, I used to fool around
But I couldn’t take the punishment, and had to settle down
Now I’m playing it real straight, and yes I cut my hair
You might think I’m crazy, but I don’t even care
‘Cause I can tell what’s going on
It’s hip to be square
– Huey Lewis and the News, “Hip to be Square”
While many ETF providers have been frantically fooling around trying to launch the next hot bitcoin or marijuana fund, Vanguard Canada has been playing it oh, so cool. Instead of chasing after the crowd, they’ve recently released a hip new set of game-changers in the form of three asset allocation ETFs:
- Vanguard Conservative ETF Portfolio (VCNS) (40% equity / 60% fixed income)
- Vanguard Balanced ETF Portfolio (VBAL) (60% equity / 40% fixed income)
- Vanguard Growth ETF Portfolio (VGRO) (80% equity / 20% fixed income)
Not only are these ETFs as simple as they come, their cost and construction are likely to give most robo-advisors a run for their money. Here’s why: Robo-advisors tend to charge around 0.50% each year (and that’s on top of the underlying ETF fees of around 0.20%) to invest your cash and rebalance your portfolio. Vanguard is now offering broad market exposure consistent with your goals and risk tolerances and automatic portfolio rebalancing for about 0.25% per year. This new breed of asset allocation ETFs may lead many investors to wonder what the rest of those robo-advisor fees are buying them in comparison.
Shortly after Vanguard released its tidy new trio of ETFs, my inbox began to overflow with emails from DIY investors clamoring for more info. Ask and ye shall receive! Below are my comments and (so you know for sure it’s me), some deeper analyses. Hankering for more straight talk on the subject? My colleague Dan Bortolotti has also written about them at Canadian Couch Potato.
Canadian vs. Global Equities
In all three ETF portfolios, Vanguard has allocated 30% of the equity mix to Canadian stocks, and 70% to global stocks. This is very similar to my model ETF portfolios, which allocate about 33% to Canadian stocks and 67% to global stocks. Over the long term, these small differences should have no more than a minimal impact on returns.
Global Equity Breakdown
Each ETF portfolio has the same global equity weights: 53.7% to U.S. equities, 35.7% to developed ex North America equities, and 10.6% to emerging markets equities (as of December 31, 2017). This is roughly the same global equity allocation as my model ETF portfolios.
The market capitalization for the underlying indices (as of December 31, 2017) also has the exact same weightings. This suggests that Vanguard is not trying to actively manage the global equity allocations, which is a good thing for us passive investors.
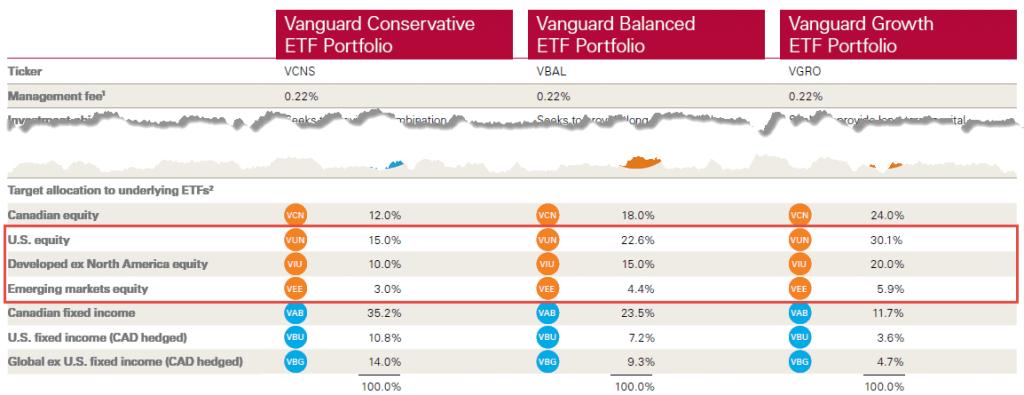
Source: Vanguard Canada as of December 31, 2017
Global Equity Market Capitalization as of December 31, 2017
| Asset Class | Index | Market Cap (USD Millions) | Market Cap (%) |
|---|---|---|---|
| U.S. Equity | CRSP U.S. Total Market Cap Index | $27,452,976 | 53.7% |
| Developed ex North America Equity | FTSE Developed All Cap ex North America Index | $18,222,191 | 35.7% |
| Emerging Markets Equity | FTSE Emerging Markets All Cap China A Inclusion Index | $5,406,288 | 10.6% |
| Total | $51,081,455 | 100.0% |
Source: CRSP and FTSE Index Fact Sheets as of December 31, 2017
Global Bonds
There is one key construction difference between my model ETF portfolios and the Vanguard asset allocation ETFs. Vanguard’s offerings include an allocation to global bonds (which are hedged back to the Canadian dollar), while my models invest only in Canadian bonds. Whether this will make a material difference in future returns is yet to be seen. I don’t plan to lose sleep over it myself.
Foreign interest paid from the Vanguard Global ex-U.S. Aggregate Bond Index ETF (CAD-hedged) (VBG) will be subject to unrecoverable foreign withholding taxes when held in an RRSP or TFSA account. In the fund’s latest annual report, 15% of foreign interest earned was withheld. The fund’s current average coupon is 2.1%, resulting in an annual foreign withholding tax drag of about 0.32% (2.1% x 15%).
Foreign Withholding Taxes
For the developed ex North America equity allocation, I was pleased to see that Vanguard had decided to hold the Vanguard FTSE Developed All Cap ex North America Index ETF (VIU), instead of a combination of the Vanguard FTSE Europe ETF (VGK) and the Vanguard FTSE Pacific ETF (VPL). They had opted for the combo-holding for the Vanguard FTSE Global All Cap ex Canada Index ETF (VXC), but this small holding change for the new funds should slightly increase their tax efficiency; VIU will only be subject to one level of unrecoverable foreign withholding taxes in tax-free and registered accounts.
To see how the overall foreign withholding tax drag would shake out in an RRSP or TFSA account, download my Vanguard Asset Allocation ETF model portfolio returns.
Back-Testing Bonanza
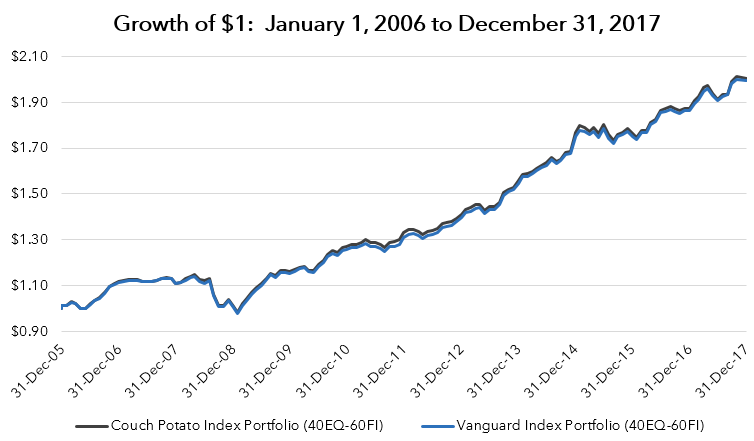
If you’re curious whether these differences would have had a material impact on past returns, look no further. I’ve compared the past returns of three hypothetical Couch Potato Index Portfolios (which exclude global bonds and have a slightly higher allocation to Canadian stocks) to three Vanguard Index Portfolios. I’ve used FTSE indices for the Canadian stocks, global stocks and Canadian bonds, as well as a Bloomberg Barclays Index (hedged to CAD) for the global bonds.
Spoiler Alert: The returns are almost identical.
Conservative Index Portfolio
Asset Allocation: 40% Equities / 60% Fixed Income
| Asset Class | Index | Couch Potato Index Portfolio (40EQ-60FI) | Vanguard Index Portfolio (40EQ-60FI) |
|---|---|---|---|
| Canadian Equities | FTSE Canada All Cap Index ETF | 13% | 12% |
| Global Equities | FTSE Global All Cap ex Canada China A Inclusion Index | 27% | 28% |
| Canadian Bonds | FTSE TMX Canada Universe Bond Index | 60% | 35.2% |
| Global Bonds (CAD hedged) | Bloomberg Barclays Global Aggregate Bond Index (hedged to CAD) | 0% | 24.8% |
| Total | 100% | 100% |
*Portfolios are rebalanced annually
Source: Morningstar Direct
Conservative Index Portfolio Performance: January 1, 2006 to December 31, 2017
| Conservative Index Portfolio (40EQ-60FI) | 1 Year | 3-Year (Annualized) | 5-Year (Annualized) | 10-Year (Annualized) | Since 2006 |
|---|---|---|---|---|---|
| Couch Potato | 6.90% | 5.91% | 7.52% | 5.87% | 5.95% |
| Vanguard | 6.99% | 5.98% | 7.69% | 5.86% | 5.92% |
Source: Morningstar Direct
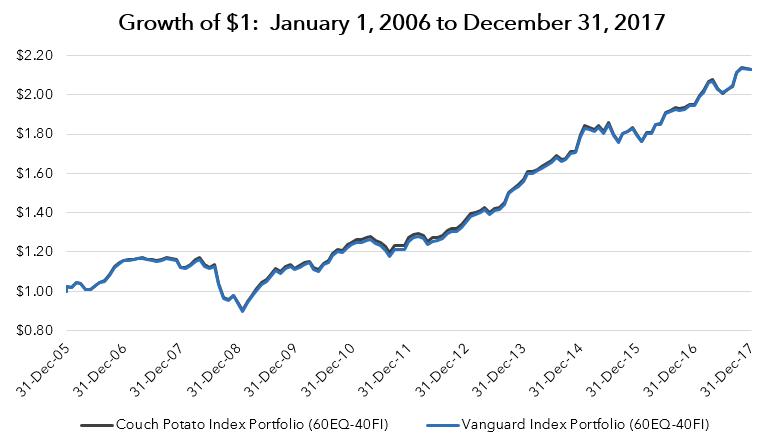
Balanced Index Portfolio
Asset Allocation: 60% Equities / 40% Fixed Income
| Asset Class | Index | Couch Potato Index Portfolio (60EQ-40FI) | Vanguard Index Portfolio (60EQ-40FI) |
|---|---|---|---|
| Canadian Equities | FTSE Canada All Cap Index ETF | 20% | 18% |
| Global Equities | FTSE Global All Cap ex Canada China A Inclusion Index | 40% | 42% |
| Canadian Bonds | FTSE TMX Canada Universe Bond Index | 40% | 23.5% |
| Global Bonds (CAD hedged) | Bloomberg Barclays Global Aggregate Bond Index (hedged to CAD) | 0% | 16.5% |
| Total | 100% | 100% |
*Portfolios are rebalanced annually.
Source: Morningstar Direct
Balanced Index Portfolio Performance: January 1, 2006 to December 31, 2017
| Balanced Index Portfolio (60EQ-40FI) | 1 Year | 3-Year (Annualized) | 5-Year (Annualized) | 10-Year (Annualized) | Since 2006 |
|---|---|---|---|---|---|
| Couch Potato | 9.05% | 7.55% | 9.69% | 6.27% | 6.50% |
| Vanguard | 9.21% | 7.67% | 9.91% | 6.30% | 6.49% |
Source: Morningstar Direct
Growth Index Portfolio
Asset Allocation: 80% Equities / 20% Fixed Income
| Asset Class | Index | Couch Potato Index Portfolio (80EQ-20FI) | Vanguard Index Portfolio (80EQ-20FI) |
|---|---|---|---|
| Canadian Equities | FTSE Canada All Cap Index ETF | 27% | 24% |
| Global Equities | FTSE Global All Cap ex Canada China A Inclusion Index | 53% | 56% |
| Canadian Bonds | FTSE TMX Canada Universe Bond Index | 20% | 11.7% |
| Global Bonds (CAD hedged) | Bloomberg Barclays Global Aggregate Bond Index (hedged to CAD) | 0% | 8.3% |
| Total | 100% | 100% |
*Portfolios are rebalanced annually.
Source: Morningstar Direct
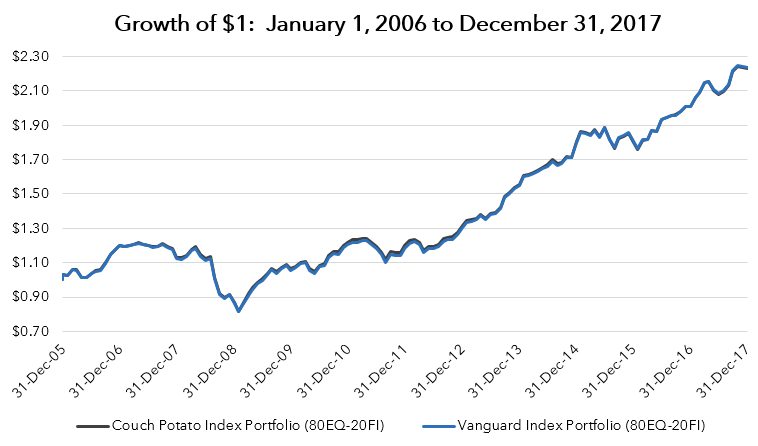
Growth Index Portfolio Performance: January 1, 2006 to December 31, 2017
| Growth Index Portfolio (80EQ-20FI) | 1 Year | 3-Year (Annualized) | 5-Year (Annualized) | 10-Year (Annualized) | Since 2006 |
|---|---|---|---|---|---|
| Couch Potato | 11.21% | 9.19% | 11.85% | 6.54% | 6.92% |
| Vanguard | 11.43% | 9.36% | 12.11% | 6.61% | 6.94% |
Source: Morningstar Direct
So, once you’re done squinting at the two, nearly identical lines in the charts in the back-tested comparisons above, let me know if I can answer more questions. Otherwise, consider yourself hip to the news on these three new Vanguard asset class ETFs. For me, the take-home is: It’s about time somebody squared away this sort of offering.
Hi Justin,
Thank you for helping us DIY investors, it is much appreciated.
This month, I’m going to buy close to 20 000 shares of VBAL.
I’m sure you buy much larger numbers of shares before your second coffee of the day, but I’ve never bought so many shares in one swoop.
I’m going to use the limit function to protect myself in case the stock price surges for some reason.
Other than that, is there anything I should be doing or thinking about?
Thanks!
Nicolas in Montreal.
@Nicolas: It sounds like you’ve got it all covered! (I always recommend using limit orders, especially on bigger trades). If you’re with a brokerage that charges ECN fees (like Questrade), you may find the total commission is relatively high though.
Hello Justin,
If I was to only hold VGRO in my CCPC and I received a dividend of 50K a year from VGRO.
Approximately what percentage would I get to keep roughly? Let’s assume that I early retire and I ONLY receive this dividend? I am a BC resident.
I am trying to figure out do I get 50% of the dividend amount or more to live spend.
@Emily: You would have to speak with your accountant regarding this personal/corporate tax question. There would also be additional tax drag on foreign dividend income in your corporation (due to the dividend refund mechanism not working properly):
https://canadianportfoliomanagerblog.com/taxation-of-foreign-income-in-a-corporate-account/
Hello Justin,
Sorry for being so late to the party.
But is it safe to say that going 100% VGRO is a fabulous choice for RRSP, RESP and TFSA if you don’t want to be crazy hands-on but avoid the crazy MER through other non-DIY brokerages?
However, for someone who is a HCP and incorporated, taking the corporate money and investing in ZDB is wiser than VGRO, yes?
Thank you!
@Luke: ZDB has been more tax-efficient than VAB/VBU/VBG historically – this is expected going forward (for the time being), but is certainly not a guarantee (as foreign currency-hedged bonds could possibly outperform Canadian bonds, so this could offset any tax-efficiency benefits of ZDB). GICs could also be an option for taxable accounts.
For smaller RRSP accounts, VGRO is a suitable option (if the fund’s risk is appropriate for the investor). For larger RRSP accounts (well over $100K), it could make sense to hold the foreign equity ETFs directly (to reduce the FWT drag). There’s no FWT benefit of breaking up VGRO in an RESP/TFSA, so it’s a suitable option in these accounts.
Hope this helps!
I have a CCPC as well. I am having difficulty with deciding to hold VBAL across my RRSP, TFSA and CCPC.
Or hold all GICs in my RRSP and then use VEQT to help balance a 60/40 portfolio in my CCPC.
Ben Felix and Cameron keeps saying that the tax issue for VBAL is not a permanent thing. Also once they said that it’s just “small potatoes”.
So now I am confused if I am making my life harder by not holding VBAL across all these accounts.
@Emily: Although investing in VBAL across accounts isn’t the most tax-efficient or low-cost strategy, it’s still a very reasonable choice for DIY investors. If you’ve already made the decision not to use an advisor, the cost savings in management fees (assuming no other value-add from the advisor) will likely offset the tax-inefficiencies of the strategy.
When I first wrote about the tax-inefficiency of premium bonds in taxable accounts in February 2012 (which is what Ben Felix and Cameron are talking about when they refer to the “tax issue for VBAL”), every naysayer commented that “it’s not a permanent thing, don’t worry about it”. That was 7 years ago.
Today, the weighted average coupon on a broad-market bond ETF is 3.19%, while the weighted-average yield-to-maturity (YTM) is 2.45% (when the coupon is higher than the YTM, you have tax-inefficiencies in taxable accounts, due to the underlying premium bonds in the ETF). This is still a concern for investors with large taxable portfolios (and may be for the foreseeable future – we just don’t know).
Hi Justin. Great work as usual.
– With ETFs like these that hold both bonds and stocks, I was wondering if the distribution paid to the investor includes both the interests from the bonds holdings and the dividends from the stocks holdings, or are these treated as two different things and paid to the investor at different times during the year?
– Any idea what the payment schedule is for each?
– And finally, is there a risk of “bad timing” with these products, i.e. selling just before distribution day and leaving money on the table that you technically earned and are entitled to?
Thank you very much!
@Gui: For 2018, each quarterly dividend payment for VBAL and VGRO include a mix of interest income, Canadian dividends and foreign dividends (capital gains are generally distributed at year-end) – this would be expected going forward as well.
There’s no risk of not receiving what you are entitled to when you sell the ETF: https://canadiancouchpotato.com/2013/05/09/etf-dividend-dates-explained/
Hi Justin,
Quick question from a learning perspective. I saw your tweet today that you created a spreadsheet that calculates the estimated FWT on different ETFs in different accounts (THANK YOU!).
Specifically for VGRO (or any XAW) I know the MER is 0.25%, but in your spreadsheet under TFSA you have the FWT as 0.21% and RRSP 0.21% and Taxable account 0.02%.
Here is my question, with respect to FWT, does that mean the actual cost for this ETF in a TFSA/RRSP is 0.46%, and Taxable is 0.27% ?
Am I understanding this correctly?
If yes, then would XAW be the same with the MER 0.22% PLUS the respective account types %iles you listed?
Thanks Justin, always learning from you and much appreciated.
@Vito: You are correct – you would add the MER cost and the FWT cost to equal the total MER + FWT cost.
Hi Justin,
Great post. Question from someone who doesn’t mind dealing with 7 ETFs instead of one.
-VGRO.TO has 0.22% management fees
-But if you weight average (based on allocation) the fees for the 7 underlying ETFs, you get 0.14% management fees
Why buy VGRO.TO then? if you can easily reproduce this asset allocation in your portfolio and save 8 bps on management fees? (0.22% – 0.14% = 0.08%)
@Charles Potato: Although you may enjoy managing a 7 ETF portfolio, I think it’s safe to say that most investors don’t feel the same (especially if they’re making monthly contributions).
Also, if the portfolio size is small, the 0.09% difference in actual dollars paid would be relatively small as well. For example, on a $10,000 portfolio, the difference in fees would be 75 cents per month.
I wouldn’t have a problem managing an 7 ETF portfolio (not true, but just wait for my point)….if it weren’t for the fact that I have to do at across (at least) 2 accounts – TFSA and RRSP (because I’m not rich enough to have maxed them both out and have unregistered investments.
I’ve got a 5 ETF portfolio and it’s become impossible to rebalance across two accounts without selling everything and rebuying everything. Which, again, isn’t a problem if all you’re doing is rebalancing, but most of us are contributing and it just throws everything out of balance so quickly by trying to take advantage of the RRSP/TFSA tax shelter depending on your income.
VGRO is stupidly simple – my RRSP owns 100% VGRO, and my TFSA owns 100% VGRO. Even if the cost differential were a lot more than 75 cents a month per $10,000, it would be worth it for the actively contributing investor.
Hi Justin,
Great article. I am curious if you’ve calculated a gestalt difference in the cost of your model portfolios and the vanguard balanced portfolios. I realize we won’t know fully for some time and it would depend on the relative amount of the portfolio in different accounts, but as a “back of the envelope” calculation could you assume around 0.1% difference in management fees in all accounts, around 0.3% on US equities’ dividends from foreign withholding tax that could have been recovered in an RRSP, and then whatever your marginal tax is on the interest generated from fixed income being held in a non-registered account (for ease, lets assume a top marginal tax of 50%, if you had 40% of your assets in fixed income it would be roughly 50% tax on a roughly 3% annual interest on 40% of your assets = roughly 0.6% in taxes on assets in a non-registered account that could be avoided if you had held these in a registered account)? Am I missing anything major?
Thanks,
Dan
@Dan: Thank you for the suggestion – I may look at writing a simplified piece about the true cost of using the new Vanguard Asset Allocation ETFs (vs. DIY vs. using a competent advisor).
I think there would be a lot of interest in a write up like this Justin! I just happened to get into DIY investing just as you posted this article. So i decided to give these “Hip new ETFs” a try.
I think I may switch to a more traditional DIY approach in the future if the true cost of the new Vanguard Asset Allocation ETFs prove to be significantly more than a DIY approach.
Btw…I really appreciate this website; keep up the great work!
Andy
@Andy: Glad you like the blog – thanks for reading!
Justin,
How is the tax efficiency of the new Vanguard’s mutual funds VIC100, VIC200, VIC300, BIC400, in comparison to Vanguard’s asset allocation ETFs? Also, since the mutual funds are actively managed, I suppose the slightly higher MERs of 0.5% may be worth it.
Thanks
@Victor Rajkotwala: As the funds are new, there is no information available about their tax-efficiency (although since they’re more expensive than a plain-vanilla ETF, this would offset more of the ETF’s income, leading to higher tax-efficiency but with lower expected returns).
Not sure how a more expensive actively managed fund may be worth it.
Regarding the Global bonds low YTM. Also had this thinking but I think it’s not as big of a deal because it’s hedged. And the hedge will earn money based on the interest rate differential. So return will end up being similar, but with the benefit of less volatility. (But, there’s a higher MER, and foreign withholding taxes).
@Chris: Thank you for the heads up. You’re correct regarding the irrelevance of the lower YTM on the currency-hedged international bond ETF (due to the “hedge return”). I’ve updated the post accordingly.
Justin,
Thanks for the awesome summary! Looking at the performance of 3 ETFs (VCNS, VBAL, VGRO), they seem to not differ by much.. With VGRO involving much more equities than the other two, should we not expect it be more volatile? I am new to ETF, if I am overlooking anything please pardon me.
@Rainer: Bonds did very well over the measurement period, relative to equities, which is why there is not much difference in returns for various asset allocations. To assume that this will be the case over the next 20 years as well may not be realistic (bond yields are hovering just below 3%, while equities have expected returns between 6-8%).
Wonderful work, as is customary. This review motivated us to align and consolidate our (already) Global Neutral Balanced portfolio (now 73% Indexed in Equities) by rationalizing both our RRIFs and TFSAs with VCNS in the former and VGRO in the latter. Have always had a domino effect with our multiple accounts where juggling our ETFs really needed coordination to maintain the regional mix. With our latest changes, our accounts are more synchronized with each other.
I wondered if there was a possibility of gaining individual year performance numbers on the three Vanguard funds, as your back-testing of the component ETFs in the mix was way more extensive than my drudgery of doing the same just for 2016 and 2017, as a prelude to considering the switches we have made?
Hi Justin,
I discovered your blog through the Canadian Couch Potato blog. Thanks for sharing so much great info. My question is about your back-tested results, comparing Vanguard and the Couch Potato portfolio. It looks like the Vanguard funds would have produced a slightly higher return when comparing the returns of the Couch Potato portfolio from a shorter position, but when comparing the longest position (since 2006) the Couch potato portfolio fared slightly better. Can you please explain why that is? Thank you.
-Mike
@Mike: The difference is caused by global bond performance vs. Canadian bond performance over those periods.
Justin,
I just pulled my money over from a brokerage and decided this approach:
-Maximized TFSAs and RRSPs with VBAL
-Used your taxable model portfolio for taxable accounts
Jeremy
Hi Justin
How does vanguard VBAL FUND compare to TD E series portfolio when both MER and FWT and calculated…how much difference in cost between these options? (excluding any cost for ETF TRADES).This would be in a RRSP. Thanks for info and insight for Canadian investors trying to navigate and educate ourselves.
@Jon: VBAL would have similar foreign withholding tax implications as a TD e-Series portfolio (with the exception that VBAL has a portion in VBG, which withholds about 15% of the bond coupon interest – this would only be expected to add about a 0.04% drag overall though).
So the TD e-Series portfolio would be about 0.15% more expensive per year (in terms of MER and FWT) than VBAL.
My parents are 80 and 89 year old pensioners in good health. Through a recent inheritance from a long-lost relative, they now have ~$1M cash coming their way, and I (long time Vanguard investor living in the USA) am trying to help them invest the money in the most hands-off way possible that will generate a bit of income to supplement their $30K pension income (they have no other significant savings, and (luckily) no debts).
Your comments above indicate these ETFs might not be the best option, but given that they have 0 investment experience, and given their already-low income, might they be an OK option at least? I also have the option of a wealth management guy I know and trust who will make a nice Canadian-only portfolio for 0.25%, and which would give my parents a face to talk to. But I do like the overall stock/bond/international/domestic balance of these new Vanguard ETFs.
Opinions welcome!
@Dave: As I am unfamiliar with your parent’s financial situation and risk tolerance, I cannot provide any specific advice.
However, if they are unable to manage their own portfolio, you may want to encourage them to seek professional assistance.
Does holding US$ ETFs in an RSP (at TD Direct Investing), such as what is being described in your model portfolios still require the Norbit gambit strategy?
I was under the impression that you can now open a US$ RSP component to complement the CAD$ RSP so that all trades and income settle in US dollars.
The only issue at the moment is when it comes time to convert the plan to a RIF because there isn’t a US$ RIF just yet. I did hear that it’s on the way soon though.
Thoughts?
@Marc: You have always been able to buy US-listed securities at your discount brokerage and accept their inflated FX rate (they force the currency conversion), or you can convert the currency cheaper using Norbert’s gambit.
I invest the 3 ETF couch potato. I can see the attraction of these funds, but I have one concern. What happens when I want to draw down after retirement and at that time equities are doing badly but bonds are doing well? I can’t just cash in my bonds while waiting for equities to recover, I have to cash in both bonds and equities. Am I missing something?
@Philip: During retirement, you will likely want to break up the fund so that you can manage the portfolio for your specific cash flow needs.
Hello Justin. Like so many others, I want to thank you and Dan for your generous, hard work. Just one quick question: why aren’t Horizons’ total yield indexes more popular for margin accounts and TFSAs.? Are their inherent added risks significant enough to offset their advantages?
@jamie: You’re very welcome!
In TFSA accounts, the swap fees on the Horizons ETFs offset any foreign withholding tax savings from investing in swap-based ETFs (so most investors will not hold them here). For taxable accounts, the counterparty risk and taxation risk of the swap-based ETFs should be weighed by each investor (as their tax situations and risk profiles would be different).
I don’t personally use these products (as I can’t calculate the actual risk, so I prefer to avoid it).
Any idea on the Dividend Yield and Frequency?
What dividend yield will they distribute and how often?
@Alan: The annual distribution yield for the funds will likely be between 2-2.5% (after fees and foreign withholding taxes). I’m assuming the funds will have a quarterly distribution frequency.
Hi Justin,
I have maxed out my TFSA and RRSP accounts with ETFs (CCP and CPM portfolios) and I am sitting on some idle cash. In this column you don’t recommend these new Vanguard products for non registered accounts and in the comments you suggest it is because of the bond allocation which i still find a bit confusing. Are there other better options for non registered ETF investing?
Thanks,
Ken
@Ken Pearce: This topic has been covered in numerous articles:
https://canadianportfoliomanagerblog.com/dont-discount-zdb-just-yet/
https://canadianportfoliomanagerblog.com/bxf-tears-a-strip-off-competitors/
https://www.theglobeandmail.com/globe-investor/investor-education/bonds-or-gics-for-taxable-investors-the-choice-is-clear/article5356721/
Thanks for the very timely information on the new Vanguard ETFs. What do you make of the Morningstar.ca article, “Amid market plunge, some ETFs traded at steep premiums” (http://cawidgets.morningstar.ca/ArticleTemplate/ArticleGL.aspx?culture=en-CA&SAL=false&id=847876)? Perhaps one should wait for a bit more trading volume before considering Vanguard’s new ETFs?
@Herman A. van den Berg: I wouldn’t be too concerned with these articles. As always, investors should not be buying or selling ETFs when the market is just opening or closing (generally within 30 minutes of the open or close). If an ETF has an extremely wide bid-ask spread (i.e. more than 5 cents), investors should consider holding off on trading it.
Justin
As usual, wonderful and precise information. Thank you.
I am not the usual long term investor, given that I am 71 with a health problem.
I have GICs coming due from trading down from a home sold two years ago in the amount of about 500k.
I was thinking the Vanguard VGRO may be the answer for non reg account. 80/20% hoping the bond tax situation would be not too bad and FWT could be recovered. No room anywhere else. We will not need this money. It will be a legacy for kids and Gkids. We are beyond managing the portfolio and re-balancing.
Your suggestion please.
Cheers
Brian
@Brian: You may want to discuss your estate planning with your children and other professionals. As you mention that you and your spouse are beyond managing the portfolio and re-balancing, you may need to seek additional help going forward.
Hey Justin,
Thanks for the great insight. As soon as these new ETFs were announced I was very much looking forward to new blog entries from both you and Mr. Bortolotti. No questions this time around just wanted to show my appreciation for taking the time to educate the amateur investor on a regular basis. Have a fantastic weekend!
PS For any millennials out there when you hear the song “Hip To Be Square” is anyone else reminded of American Psycho? Christian Bale rocked that role. :)
I have been keeping my “Powder Dry” waiting for a correction and as a result have about $900K sitting in a 2.3% High Interest savings account.. What ETFs would you put your money in, in a taxable account, if it were your money. I am 73 and my TFSA and RRIF are maxed out and I have a DB pension that pays out $28K annually and I still work.
Your thoughts?
@Hank: I already post the exact portfolios that I invest in personally: https://www.canadianportfoliomanagerblog.com/model-etf-portfolios/
For me, and other retirees who count on income from their investments, which of the three, if any works best. If their is a balanced global income out there, that pays monthly income, so I don’t have to sell off portions yearly, I would appreciate hearing about it.
Hey Justin,
Great write up! I just started your RRSP 80/20 plan last month with about 70k invested. But am thinking about switching to the VGRO, as it is automatically rebalanced. Would tax efficiency be roughly the same or no?
@Ian: If you’re holding US-listed foreign equity ETFs in an RRSP account, these would be more tax-efficient than VGRO. If you are holding Canadian-listed foreign equity ETFs, the tax-efficiency would be roughly equivalent in an RRSP account to VGRO.
Hi Justin,
Thanks so much for the analysis. I’m not sure I understand why the tables in the tax withholding section gives different returns than the charts here? I also see different numbers in the model portfolios. So for example, if i look at 60/40, the 10yr return is 6.26 CCP TFSA and 6.03 vanguard.
Thanks again!
@Noah: The returns in the blog chart are index returns before fees, the PDF report is index returns after expected ETF fees.
In the blog, I’ve compared a Couch Potato-like “index” portfolio against a Vanguard “Index” Portfolio before fees. The point was to show that adding global bonds or changing the mix between Canadian and global stocks slightly is not expected to make much of a difference to returns.
Hi Justin,
Thanks for all the information! It’s amazing. Just want to make sure I understand this properly. If fees were factored in, is it reasonable to reduce the estimates from your table as follows (for the 80 / 20 split):
Vanguard: 6.94 – 0.25 MER = 6.69%
Couch Potato: 6.92-0.11 MER = 6.81%
Still not a big difference I know. I am looking to make the switch from robo-advisor to DIY (Questrade) for registered accounts and want to make sure I make the right decision and don’t feel the need to change again later.
Thanks!
Steven
@Steven: Please keep in mind that these are hypothetical figures (I could substitute different indices to back-test and make either portfolio look better or worse).
If you’re new to investing and looking for a one-fund solution, the new Vanguard ETFs may be appropriate (it wouldn’t be that big of a hassle at a later date to sell the fund and replace it with more ETFs if you decided to).
So the 64 dollar question is… if you were to enter the market now with substantial new funds (say a hundred K+), would you bother with a couch potato setup that required maintenance or simply buy the appropriate Vanguard offering? The post would seem to indicate that the Vanguard offering is the best ‘hands off’ solution.
Thanks.
@Ken Wilson: I believe you’ve answered your own question. If you’re looking for a low-cost hands-off solution, the Vanguard Asset Allocation ETFs are a great option for registered and tax-free accounts. If you’re looking to optimize every last basis point in fees, foreign withholding taxes and regular taxes, putting more effort into your portfolio management could lead to better results (that’s assuming the investor does everything correctly).
Hi Justin,
In a taxable account, to use VGRO as the example, if the potential tax drag is O.1% and the MER is 0.25% and FWT of 0.17% does it appear that the all in cost approximates 0.52% for this ETF. Would you recommend this ETF in a taxable account or consider XAW as an alternative if you were getting FI from a GIC or ZDB and didn’t require Canadian exposure? For an investor who would pay commissions to buy and sell, not using Questrade. Thanks so much for all the analysis you do. Quite impressive considering the short time frame since these ETF launched.
@Sue: The foreign withholding tax drag of VGRO in a taxable account would be about 0.01% (not 0.17% – that’s for RRSP and TFSA accounts) – this is not the issue with holding VGRO in a taxable account.
I would not recommend any of these ETFs for taxable accounts, due to the premium bond issue of the underlying bond ETFs. A 3-ETF portfolio, using ZDB as the bond component would likely make more sense (depending on the size of the taxable account and the cost of trading commissions).
thank you – a great explanation that is very helpful
Hi Justin,
You are correct. I am not versed in bonds as I originally wanted to stay with laddered GICs in my fixed income portion. However, the ability to have a Global Asset Allocation with Vanguard is too enticing for me now.
I tend not to invest for tax efficiency alone but prefer simplicity more nowadays. Likely holding VGRO will make me review my portfolio much less and that is a wonderful concept.
Your blog is wonderful and your information is greatly appreciated.
Much thanks Justin!
Hi Justin,
Thank you for this review! I have a CCPC and would like to hold the VGRO in it long term. I recognize there is a balance of higher taxes but also the issue of keeping it very simple. Although you do not recommend holding this is in a taxable account, could you give an general approximation of my loss by holding VGRO versus splitting this up into more tax efficient options.
I tend to keep cash in my CCPC as laddered GICs as well so I figure the tax efficiency of VGRO must be better than those.
@Miwo: I may take a look at this in the future, but if I had to take a guess, I would say it would add a drag of about 0.10% on VGRO.
GICs are very tax-efficient in taxable accounts (so you may be missing the logic of the premium bond taxation issue).
Thanks Justin,
I think with about 0.10% drag with buying VGRO in my CCPC, I will take the plunge.
Nothing is free so I will accept this drag for the trade of minimizing complexity.
I think 75% VGRO and 25% GICs/ High Interest Accounts will provide a 60/40 portfolio for my CCPC.
Hello Justin,
Great article as usual.
I would guess holding each ETF in a taxable account is more tax
efficient , except for the bond, part
Equities: VUN, VIU, VEE, VCN
Bonds: ZDB or BXF
Cheers
Dave
@Dave: Thanks!
The foreign withholding tax implications of holding the Vanguard Asset Allocation ETFs or the underlying Vanguard equity ETFs is identical (all foreign withholding taxes on VUN and VIU would generally be recoverable, whereas the first level of tax on VEE would be unrecoverable). This would only amount to an overall drag of about 0.01%-0.02% per year on the funds (same goes for the individual equity ETF holdings).
The tax-inefficiency of holding the Vanguard Asset Allocation ETFs in a taxable account is due to the underlying bond ETFs that have a higher average coupon relative to their average yield to maturity (i.e. premium bonds). That is why I wouldn’t recommend holding these new ETFs in a taxable account (as you mentioned, ZDB or HBB would be better candidates for bond ETFs taxable accounts).
Thanks for the information, I enjoy reading about ETFs and the tax implications for TFSA, RRSP, and Non-Registered. I have the Couch Potato account with e-series, and am wondering about tax implications with respect to TFSA and non-registered (I have the same Couch Potato balance in both TFSA and non-registered, as TFSA is maxed out). Could you provide some tax information about e-series? I’m just a bit too chicken to switch to Questrade, even with lower MER. Portfolio currently at about 80k with this TFSA and non-reg account.
Thanks for the consideration!
@Heather: The foreign withholding tax implications for US equity and international equity TD e-Series Funds are similar to the US and international equity ETFs in my model ETF portfolios (XUU and XEF).
Hi Justin, thanks for the historical analysis. From a cost perspective it seems the CCP 3-ETF portfolio is the way to go given the MER of 0.14% (Balanced) versus VBAL’s ~0.25%. Other than the global bond exposure and foreign withholding tax advantage, the main difference would be you have to re-balance CCP yourself. Are there any other material differences I’m missing? Thanks, Ryan
@Ryan: Depending on your portfolio value and the number of trades you place in a year (and the cost of these trading commissions), the CCP 3-ETF portfolio may still be more expensive than a one-fund solution. For example, a 0.11% difference in fees on a $50,000 is equal to $55 per year. If you’re paying $10 per trade and rebalancing your portfolio each year (as well as reinvesting new cash contributions), this could easily put you underwater).
No other material differences. VEE includes China A shares, while XAW doesn’t (but this is likely to change this year, when MSCI begins to add China A shares to its emerging markets indices).
Wonderful thank you. For a portfolio in the $200k-300k range using QT to buy commission free, CCP looks like the way to go.
Great to hear re:XAW and China A shares. Looks like that’s been in the works for a few years.