
There’s that saying: time is money. It’s usually true … except, of course, when we financial eggheads whip out our Sharpies® and start blathering on about time-weighted versus money-weighted rates of return. (Speaking of “The Big Bang Theory,” check out this Dimensional Fund Advisors article about how the show’s executive producer got wise with his own assets.)
Without getting too down and dirty, money-weighted rates of return show what YOU have earned after accounting for the size and timing of your cash flows, which is probably why we advisor types are required to report them to you for each of your accounts. Your own returns could be very different from an ETF’s returns if you bought or sold your positions in an ETF at particularly good or bad times, or you’re regularly transferring assets in and out along the way.
Time-weighted returns are the kind fund managers typically report in places like their fund prospectuses and (when the numbers are pretty enough) in their advertisements. It’s how the fund performed over a specified time, such as 1, 3, 5 or 10 years. It’s also the best way to determine how your whole portfolio is doing, relative to a suitable benchmark. The problem is, you need daily portfolio values in order to calculate it, and most DIY investors do not have access to these.
For a “good enough” solution to benchmarking your portfolio’s return, there’s the Modified Dietz method. I know, the name is wonky, but it’s basically a combination of the two returns above (and it only requires month-end, not daily, portfolio values). As long as there haven’t been relatively large contributions or withdrawals to or from the portfolio (combined with volatile stock market returns during the year), the monthly Modified Dietz return should closely approximate your portfolio’s time-weighted rate of return.
Calculating Your Modified Dietz Rate of Return at Questrade
Fortunately, I’m here for you, with a step-by-step tutorial on how to calculate your Modified Dietz Rate of Return at Questrade. And now, you’ve got two choices for your learning pleasure: You can continue reading this blog, or check out my video of the same.
Ready to get started? I’ve broken it into six steps.
Step 1: Download Our Free Calculator
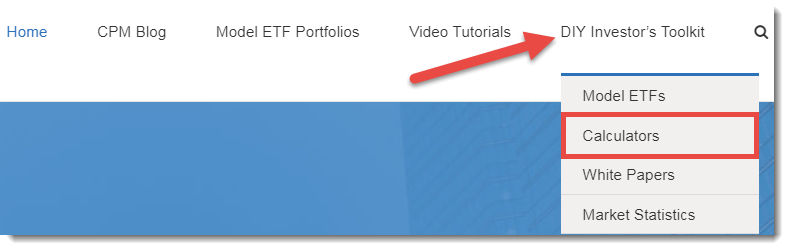
First, visit canadianportfoliomanagerblog.com to download my free rate of return calculator. Hover over the DIY Investor’s Toolkit tab at the top right of the screen, and then click on Calculators.
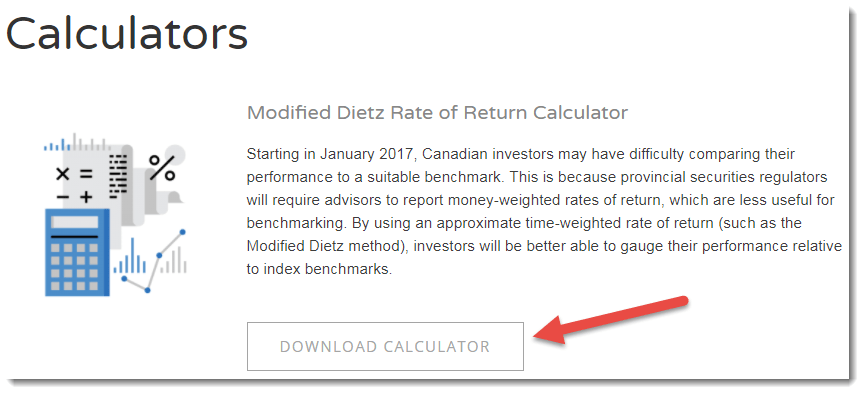
Click on the Download Calculator button underneath the Modified Dietz Rate of Return Calculator description. You can also save the file to your desktop or another location.
Step 2: Fill in the Desired Timeframe
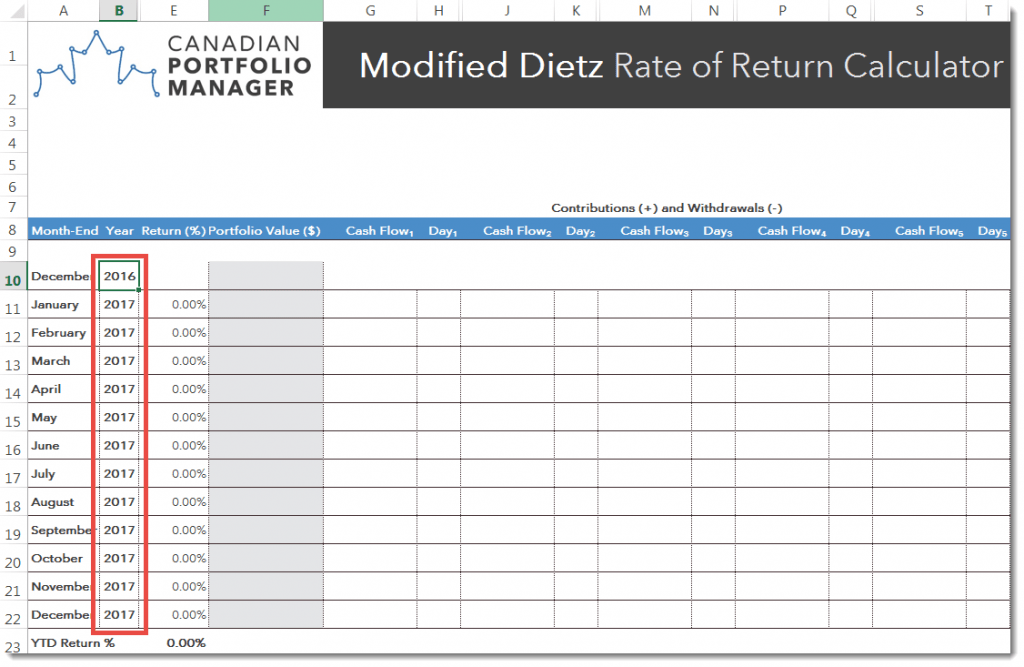
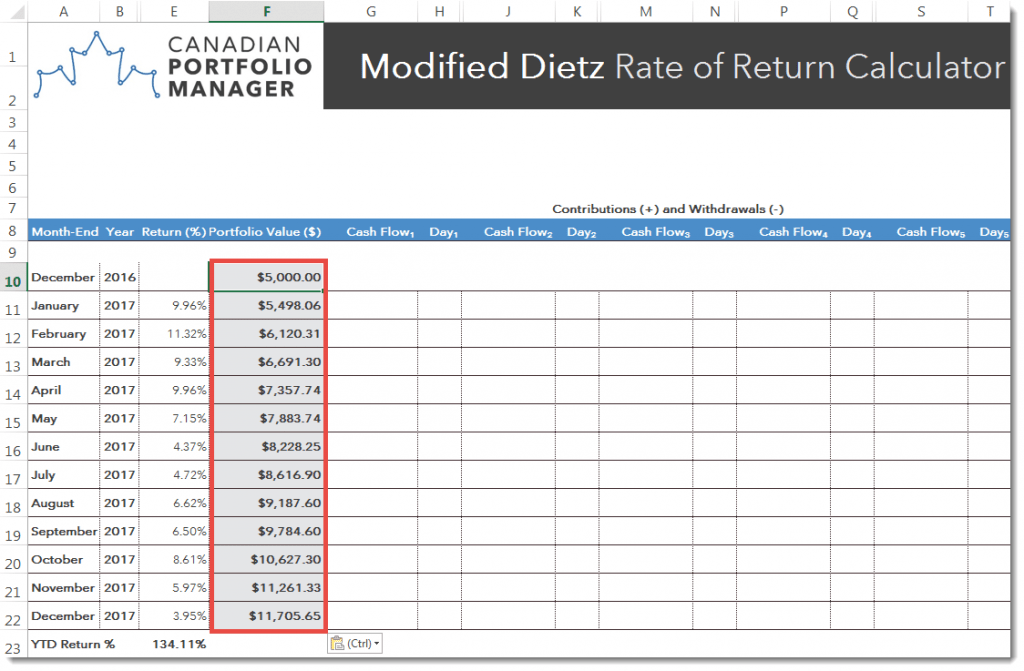
Under the Year column, we’ll enter 2016 in the empty cell to the right of the first December month-end. We’ll then enter 2017 into any remaining unlocked cells in the Year column. (Of course you’d adjust these timeframes if you’re doing this in, say, 2021.)
Step 3: Enter Your Monthly Account Balances Into the Calculator
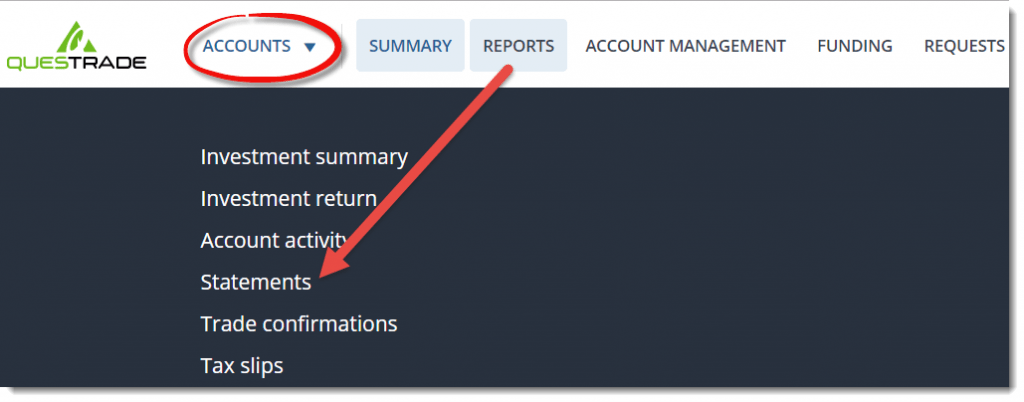
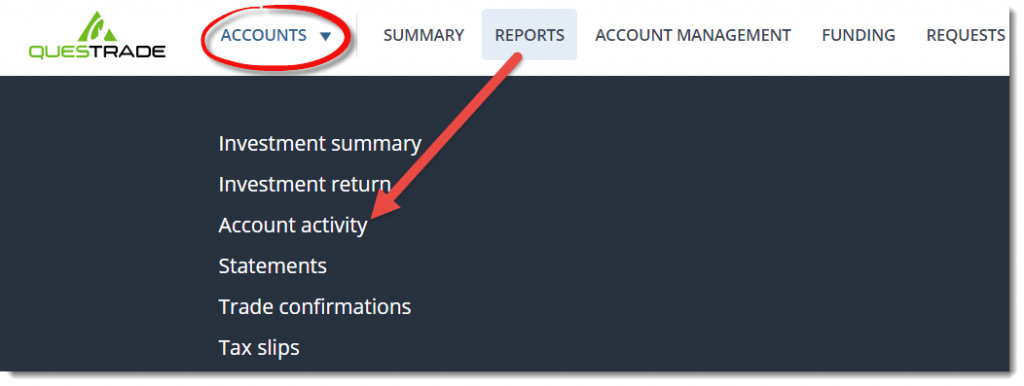
Next, log into the Questrade online platform. From the Accounts section, hover over the Reports tab and click on Statements.
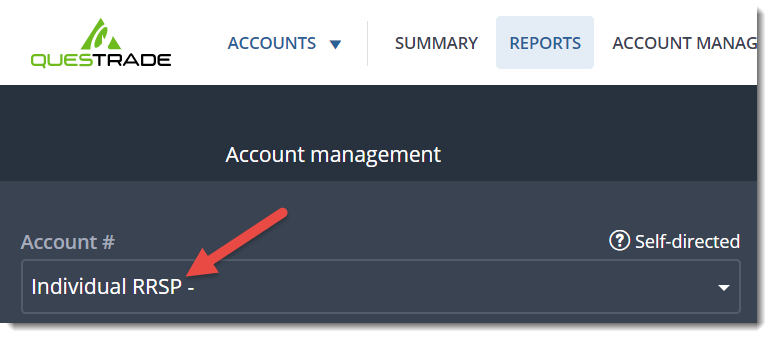
Using the drop-down menu, select the first account for which you would like to calculate a rate of return. In our example, this will be the RRSP account.
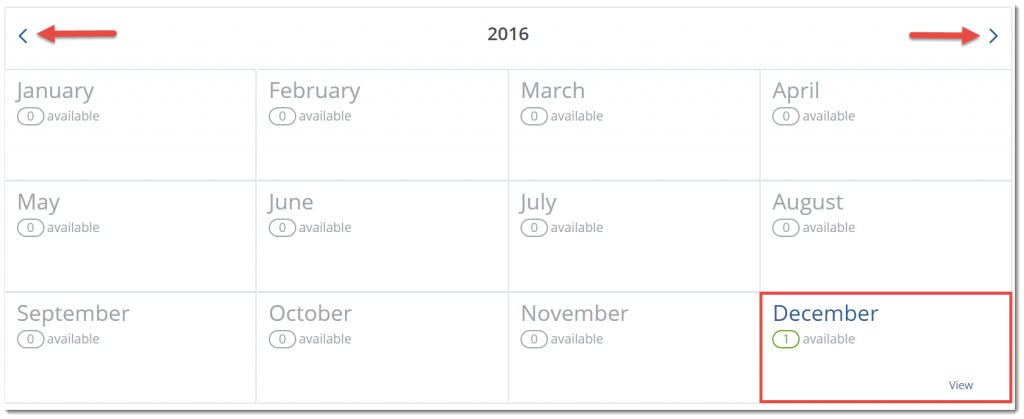
Next, using the arrows located at the left and right of the screen, locate the December statement for the year prior to the year you want to calculate. For example, since we are calculating the 2017 rate of return, we will scroll to the December 2016 statement. Click on the calendar box, and then on the download icon to the right.
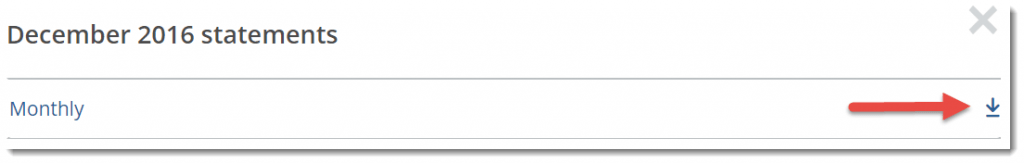
In the top-right corner of the statement, you’ll find the month-end December balance, which is $5,000 in our example.
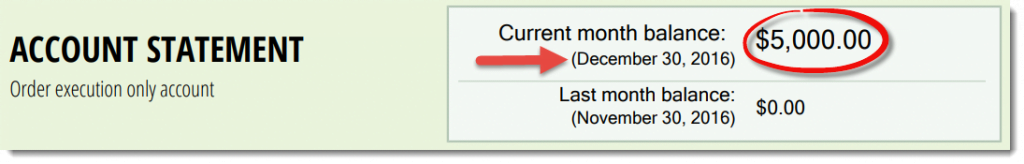
Enter this amount into our Rate of Return Calculator. It goes into the Portfolio Value column of the December 2016 month-end row.
Step 4: Aggregate All Your Account Balances
Now, if your portfolio includes more than one account, add together the month-end balances of all your accounts, and include this total figure in this same cell. For example, if you have an RRSP account and a TFSA account each worth $5,000 at the end of December 2016, enter $10,000 into this cell.
Repeat this process for the next 12 monthly statements.
Step 5: Add Your Cash Flows
Once you’ve entered all of the month-end portfolio values into the spreadsheet, you may notice that your year-to-date return looks awesome. In our example, it’s 134.11%. Don’t get too excited, though. This is because we haven’t yet entered any portfolio cash flows into the calculator. We’ll do that now.
Hover over the Reports tab again, this time clicking on Account activity.
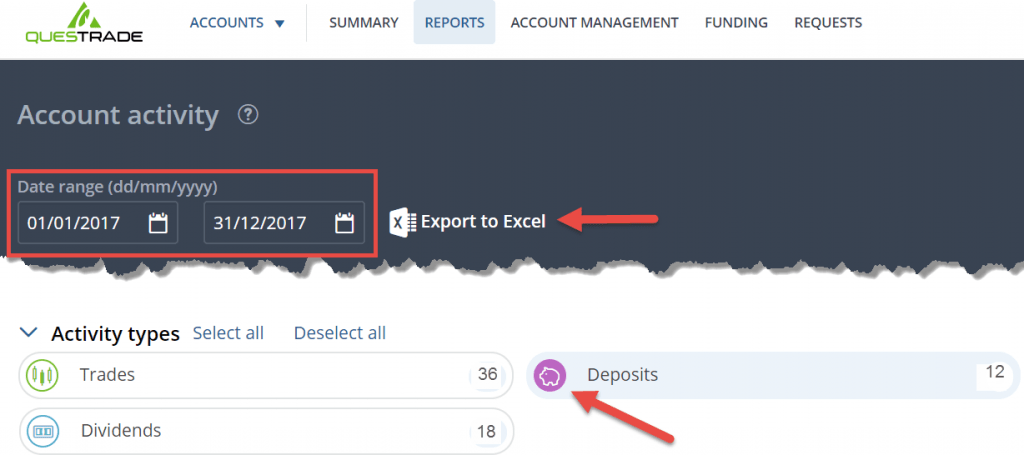
Using the Date range tool, select the one-year time frame you’re measuring. In our example, this will be January 1st to December 31st, 2017.
Next, ensure that only the Deposits and Withdrawals icons are selected as Activity types, since these are the only transactions you need to input into the calculator. (The icons will be filled in with colour if they’ve been selected.) When you’ve completed this, click on Export to Excel.
We’ll be using three data columns from the Excel download: Transaction Date, Net Amount, and Activity Type. Starting from the bottom row in our example, note that the first transaction occurred on January 16th, 2017. The net amount of this transaction was $500 and the activity type was a deposit, so we’ll enter this into the calculator as a positive value. Enter any account withdrawals as negative values.

The calculator allows for up to five cash flow events each month. If you’ve got more than that, consider switching all of your account deposits or withdrawals to the same day, so you can enter the total net amount into a single cash flow cell.
So, we’ll enter the $500 deposit as a positive value in the first Cash Flow column, and in the same row as the January 2017 month-end, and use the drop-down menu to select January 16th (the day the transaction occurred). Then, we’ll repeat the same process for the 11 remaining monthly deposits.
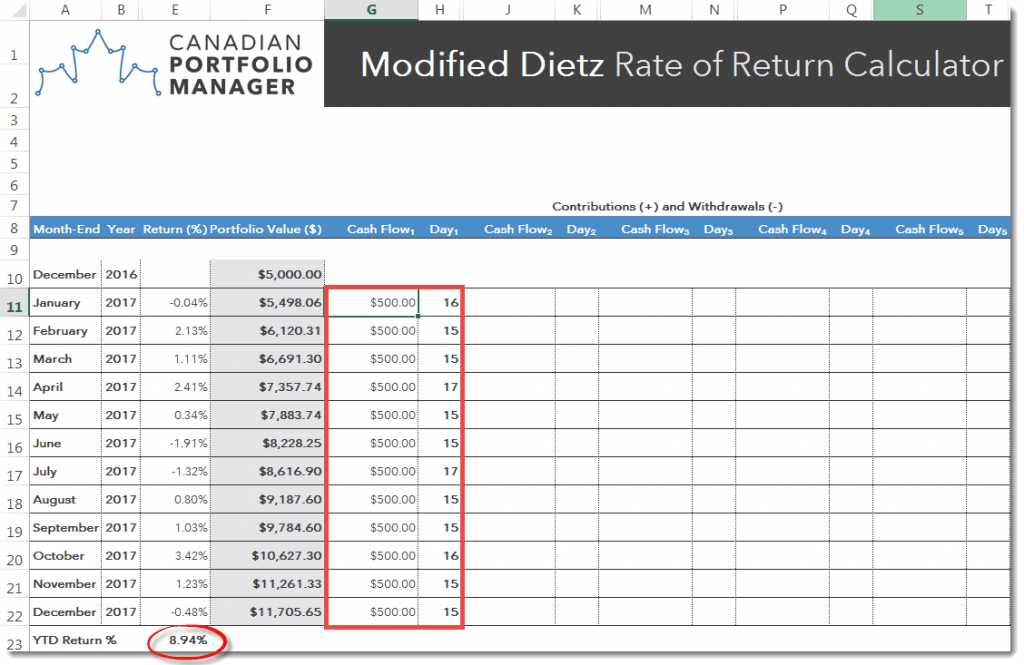
Step 6: Voila … You’ve Just Calculated Your Portfolio-Wide Return!
Now that you’ve completed all your inputs, the calculator provides you with your accurate return over the timeframe you’ve specified. In our example, our portfolio returned 8.94% for 2017.
That’s nice. But how does it compare to the “suitable benchmark” I mentioned at the outset? In my next blog/video combo, I’ll show you how to benchmark your Modified Dietz Rate of Return to a portfolio of suitable ETFs, so you can determine whether your own portfolio is a rock star or just humming along.
Hi Justin,
The examples in the excel sheet provide the ROI for one financial year very well. Is there a way to figure out the ROI from the beginning of 2016 till 2022.
Thanks
Prathibha
@Prathibha – You would just need to geometrically link the annual returns from 2016 to 2022:
https://canadianportfoliomanagerblog.com/how-to-calculate-your-average-annual-rate-of-return/
Thanks Justin! That is very helpful. I downloaded the “Modified Dietz Rate of Return Calculator” and added my statement balance in the portfolio. The Return for January 2022 month seems to be zero always, even though I entered value in December 2021. I think the formula is not considering the balance at the beginning of the year. The videos and the examples that you provided have a % value in January for Return % column. The blog does not allow me to post a pic, can you please clarify
“
@Prathibha – It could have something to do with your specific copying and pasting of the figures. Try simply typing them into the spreadsheet and see if that fixes your issue (everything is working on my end).
Questrade is a money weighted return on its monthly statements. SO by using the monthly balance they state, am I really getting a true rate of return calculation when I add in the deposits into your spreadsheet..because Questrade is already accounting for thse monthly deposits??
@Susie Trew – If you’re using the Modified Dietz Rate of Return Calculator, you’re getting an “approximate” time-weighted rate of return. Shannon has recently released a video on the Modified Dietz Method: https://www.youtube.com/watch?v=Olz-lvppTTk
Link is broken.
Justin
Lots of thought and work on this spreadsheet and the videos. Very much appreciated.
I’m new to questrade (weeks) and a lazy investor. Is there any way this could be designed so you just download the investment history of your questrade account, (deposits, purchases and sales) and “voila” out comes the ratio. No manual input required?
Also, does this spreadsheet work on Libra office Calc?
Thanks
@Mark: You’re most welcome, Mark. I’m sure there’s some complicated way to make that happen, but unfortunately, the existing spreadsheet is where my tech expertise ends.
Not sure if it works on LibreOffice Calc (I just use Microsoft Excel) – please feel free to try it out and report back to the rest of us.
Thanks Justin! I was just wondering if you recommend tracking returns separately for different accounts (e..g TFSA + RRSP), or under one spreadsheet? The holdings would be slightly different (VGRO v. CPM Model).
@Steven: I tend to track one return for the overall portfolio. If you do it this way, you should also have a target asset mix that you can benchmark the return against.
Hi Justin,
In case I did have large contributions to my portfolio, what options do I have? Since the beginning of the year, I have made contributions about 6.5x the value of my portfolio in January.
@Agnes: To be as accurate as possible, you would need to calculate your time-weighted rate of return:
https://canadianportfoliomanagerblog.com/how-to-calculate-your-time-weighted-rate-of-return-twrr/
Thank you for this! I found it to be a very useful exercise. You mention that “as long as there haven’t been relatively large contributions or withdrawals to or from the portfolio” that it should be a good approximation. Would it be possible for you to elaborate as to why this is the case?
@Jason: I go into more detail in my white paper, using actual examples: https://www.pwlcapital.com/pwl/media/pwl-media/PDF-files/White-Papers/2015-07-10_PWL_Bender-Bortolotti_Understanding-your-portfolio-s-rate-of-return_Hyperlinked.pdf?ext=.pdf
“The problem is, you need daily portfolio values in order to calculate it, and most DIY investors do not have access to these.”
I use RBC’s Direct Investing, which updates portfolio values daily. Surprised this is not standard practice.
@Rob32: I should have been more clear. To calculate their time-weighted rate of return, DIY investors would need the ability to generate their portfolio value on any historical day.
They could login to their online access whenever they make a contribution or withdrawal to their portfolio (and keep a record of their portfolio value after the contribution or withdrawal has been made), but this is not a practical solution.
Excellent! This is so useful thanks for posting!
@CG: Of course – it was my pleasure!
I love these step-by-step videos. They are so useful! Thank you for sharing your knowledge, Justin.
@Bruno: You’re very welcome! We have a few more videos that are almost complete – they should be released over the next month or so.
Your spreadsheet for this is great. I fill it in every month and keep track of things along the way.
@Bjorn: I’m so glad you find it useful :)