
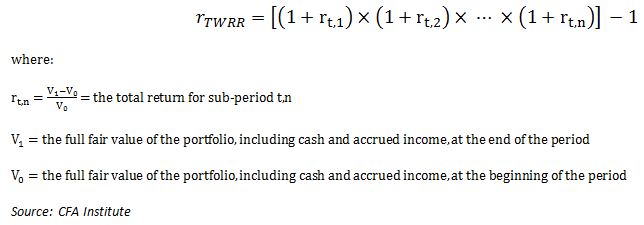
The Holy Grail of portfolio performance benchmarking is the time-weighted rate of return (TWRR). However, it requires daily portfolio valuations whenever an external cash flow (i.e. a contribution or withdrawal) occurs. Periods in which external cash flows occur are divided into sub-periods, each with its own total return calculation. These sub-period returns are then geometrically linked together to obtain the time-weighted rate of return over the measurement period (“geometric linking” is just a fancy way of saying “add 1 to each sub-period return, multiply the sub-period returns together, and then subtract 1 from the result”). The daily valuation requirement makes it very difficult for the average investor to calculate their time-weighted rate of return without the help of computational software.
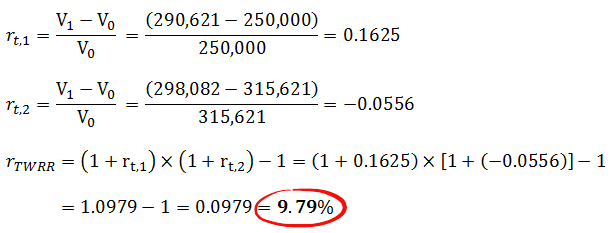
In our initial example (please refer to my blog post on How to Calculate Your Portfolio’s Rate of Return), Investor 1 initially invested $250,000 on December 31, 2013. On September 15, 2014, their portfolio was worth $290,621. They then added $25,000 to the portfolio, bringing the portfolio value up to $315,621. By the end of 2014, the portfolio had decreased to $298,082.
Investor 1 would start by calculating their first sub-period return from December 31, 2013 to September 15, 2014 (using portfolio values before the cash flow occurred). They would then calculate a second sub-period return from September 15, 2014 (using portfolio values after the cash flow occurred) to December 31, 2014. After this was done, they would geometrically link the sub-period returns to obtain their time-weighted rate of return for the year.
Example: Time-weighted rate of return for Investor 1
Investor 2 initially invested $250,000 on December 31, 2013 in the exact same portfolio as Investor 1. On September 15, 2014, their portfolio was worth $290,621. They then withdrew $25,000 from the portfolio, bringing the portfolio value down to $265,621. By the end of 2014, the portfolio had decreased to $250,860.
Using the same process, Investor 2 ends up with the exact same time-weighted rate of return for the year.
Example: Time-weighted rate of return for Investor 2
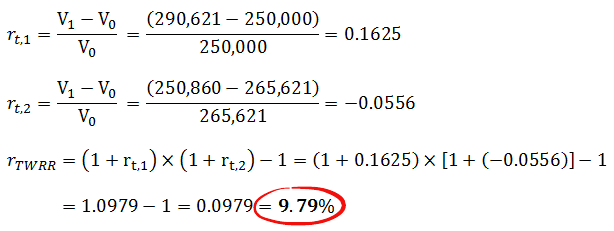
Regardless of the amounts both investors contributed or withdrew from the portfolio, they ended up with the exact same return. This is precisely the result that should be expected. The time-weighted rate of return is not affected by contributions and withdrawals into and out of the portfolio, making it the ideal choice for benchmarking portfolio managers or strategies. If we compare their return to the returns of the MSCI Canada IMI Index over the same period (which their portfolio manager was attempting to track), we also get the same result of 9.79%.
MSCI Index Performance as of December 31, 2014

Source: MSCI
Before moving onto the next section, please take note of the relative difference in the sub-period returns; the first sub-period return was 16.25% before the cash flows occurred, and a relatively worse return of -5.56% after the cash flows occurred. This difference in sub-period returns during the year is going to drive the return differences between the time-weighted rate of return and the Money-Weighted Rate of Return (MWRR).
Buenos días.
Gracias por compartir la forma de cálculo. Ahora bien, es posible tener el dinero o depósito inicial, mi pregunta es cómo saber cuanto vale mi portafolio a un fecha determinada. En el ejemplo, el valor está dado, en la vida real ¿cómo debiera calcularlo? Muchas gracias! Saludos
Hi! I wonder if let say have fee as one of the cashflow, it will be net TWRR or gross TWRR ya? consider that it will minus the outflow cashflow, somehow added back to the portfolio. Kindly enlighten me on this matter. Thank you.
@Amna – Fees reduce the portfolio values (which are also inputs in the calculations), so your TWRR is already “net” of fees. If you ADDED any fees paid back to your portfolio value, this would calculate a “gross” of fees TWRR.
[…] The formula I am using is known as TWRR. […]
Hi Justin et al
Can someone advise me why TWRR and MWRR are “Time Weighted” and “Money Weighted” respectively?
In the computaion for TWRR and MWRR where do we weight the computations for time period or $ values?
@Piyush: The TWRR measures the growth of $1 invested over the entire “time” period – it is not impacted by money flowing into or out of the portfolio. The MWRR can be impacted by “money” going into or out of the portfolio. The “weighted” part of the name doesn’t really add to the explanation of the calculation.
Hi Justin,
Can this method be used for calculating security level performance when a security is frequently traded as well?
I am currently using the same model but when securities are liquidated and bought again in a portfolio I only calculate period returns for the corresponding effective period. For example if Stock A is bought on 2019-12-01 and sold on 2020-02-21, then bought again on 2020-04-30, as of 2020-05-31 I show a NULL YTD because the the security was not held continuously between 2020-01-01 and 2020-05-31.
I wonder if it’s an acceptable industry practice to link the 2 effective periods and calculate YTD for all actively held days in 2020.
Thanks in advance!
@Roxana V: This generally wouldn’t be an acceptable way to track the performance of a single security.
Thank you for publishing this tutorial. It made me understand how to calculate my portfolio return. Now on to Money-weighted Returns…….
I have a doubt, because using this method does not work for me with the accumulated profitability.
For example:
2018: I started with $1000 and ended with $750 –> -25%
2019: I withdrawed $150, so I started with $600, and ended up with $840 –> 40%
Using this method I won 5% –> (1-0,25)*(1+0,40)-1 = 5%
But my net profit is about -$10 (I loss money).
What am I doing wrong?
@Agustin: You’re not doing anything wrong. The time-weighted rate of return calculates the return of $1 invested since the beginning of the period. It does not penalize you for bad timing (such as taking out $150 right before the market recovery).
A money-weighted rate of return, on the other hand, will penalize you for your bad market timing. That is why some investors prefer a money-weighted rate of return, which would show a negative result in this example (and be more in line with your actual experience). However, if you are benchmarking your investment strategy to an index return, you should use the TWRR (even though it doesn’t make much sense).
I know this is a little late but I think Agustin does have have his math a little wonky.
DATE BMV EMV NetGain NetAdditions
2018 1000 750 -250 0
2019 750 840 240 -150
2018 Return = -250/1000 = -25%
2019 Return = 240/750 = 32%
Linked >> (1 – 0.25)(1 + 0.32) – 1 >> -.01 or -1% return which is 10$ of loss money
Hi Sarah
Can you explain where you got the numbers in 2019
$750 is the end balance of 2018 but where did 840 and 240 come from
Thanks
Hi, thanks for a great article, this really helped me understand how the calculation works. Have a couple of questions but will start with one, how should I handle the case where an account pays interest but the balance is withdrawn on a day prior to the interest being paid. For example, assume a balance on April 1 of 100, on April 29 100 is withdrawn for a balance of 0. On April 30 interest of 2. When trying to calculate the last leg of returns the starting balance is zero, so I can’t calculate a return because I would be dividing by zero.Intuitively the return is around 2% but not sure how to get that with the TWRR method.
Appreciate your help,
Peter
@Peter L: Accrued interest should be included in the market value of the portfolio, and this should fix any issues that arise from this scenario.
Thanks for the reply Justin, appreciate it. Think I must be missing something, not sure how that solves it as I thought I was already doing that. The last cash flow event is April 29th where the remaining balance of 100 is withdrawn. On April 30 the market value is 2 (the interest posted to the account). To calculate the return on the last leg of the measured period (from April 29 to April 30) you have a starting balance of 0 and and ending balance of 2. Trying to calculate a return results in division by zero (2 – 0) / 0. Apologies if I am looking at this incorrectly. Even if there was another cashflow event (as opposed to just the end of the measure period) it still wouldn’t work because the starting balance is always 0.
Thanks,
Peter
@Peter L: Although your ending balance is $2 on April 30, your beginning balance is not zero on April 29. The accrued interest (interest earned but not yet paid) would be a value greater than $0 (perhaps $1.93, if you earned the entire 2% interest in the month of April). This accrued interest would be your market value on April 29.
I see, that makes sense now. I wasn’t focusing on the ‘accrual’ aspect of your reply, which was the main point. While that does make sense it will actually be difficult to do as I don’t get accrued interest information along the way, and nothing on the transaction will tell me what period the interest covers (to calculate it myself). Any suggestions on how people deal with that situation given the limited data available?
Thanks again,
Peter
@Peter L: Once the accrued interest is paid into the account, it will be picked up in the market value anyways, and therefore the return. The biggest issue is the zero account balance – perhaps ensure that you always have some cash in the account so there’s never a zero balance. Also try using the Modified Dietz calculator available on my blog, and see if this helps.
Thanks for the advise, I’ll come up with something to deal with this. Appreciate your help in understanding it.
Sorry for all the comments, appreciate your help and the great article, which has really helped me understand how this works. I was trying to write some code to implement the TWRR calculation but am realizing now that it really won’t work without the accrued gains/losses. My interest case above is one example, but any case where a dividend is distributed or interest is paid runs the risk of providing a false return if it is assumed to have happened on the day it is issued (cash flow events right before it can skew the return because it is not being accrued in the case of interest or applied to the record date for dividends.). Just wanted to see if that sounded correct to you? Interest and dividends would be an issue, not sure if there are other distribution types that could be an issue. If that is the case I may be better off going with the approximated approach you suggest, but wanted to see if I am thinking about this correctly, doing a true TWRR calc off a set of transactions and market data doesn’t sound possible without the accrual data (as opposed to the money weighted calc which seems to work because it doesn’t require the accruals.)
Thanks again,
Peter
@Peter L: No worries at all about the questions :)
You’re correct about the accrued interest/dividends. The accrued dividend can cause small performance reporting issues, especially at year-end (when many ETF values will drop on the ex dividend date, but the actual dividend won’t be paid until the beginning of January of the following year). Over a number of years, this isn’t really a big issue, but over a one-year reporting period, it can make the performance appear lower than the benchmark.
Thanks again, this has been very helpful. For some cash accounts where the balance gets really low (or become zero) the impact on the return can actually be pretty significant. At least this is clear to me now and I can decide what to do about it.
Thanks,
Peter
@ Justin,
That’s precisely the concern I have for TWRR.
For the definition of TWRR to hold true (“Growth in initial $1 of investments, assuming no cash flows”), there is an implied assumption that the manager is able to deploy the cash and replicate the same portfolio as it was immediately prior to the cash flow taking place.
If the manager is not able to invest the entire cash (sitting on cash – as for Manager 3 in my example) or investing the new cash in a proportion that is dissimilar to the proportion in which stocks are present in the portfolio immediately prior to cash flow taking place (etc.), the TWRR of the manager experiencing cash flow would not be same with that of the one who has not got any cash flows.
Please let me know if my understanding here is correct.
Thanks.
@Piyush: I don’t think your example showcases any issues with the TWRR methodology. It is just an example of how sitting on cash can have negative (or positive) benefits, that could create tracking error, relative to a manager who is fully invested.
Justin hi,
Further to my queries on April 12 and your response on April 15, I have another query on TWRR.
I understand the classical definition of TWRR is “Growth in initial $1 of investments, assuming no cash flows”. So it means, if we are computing TWRR of managers who are using similar strategies, their TWRR return should be similar, irrespective of what cash flows they have experienced.
I am furnishing a set of examples which comprises three managers (let’s assume hypothetically that all the three managers are running the same strategy, say, Large Cap Equity) and their TWRR performance, followed by my query.
Manager 1: Started with the Initial Capital of 10,000,000 and there was no cash flow during the month and the value of investments at the end of the month was 12,000,000 and hence a TWRR of 20.00%.
Manager 2: Started with the Initial Capital of 10,000,000and there was a cash flow of 20,000,000 on Day 16 (assume Beginning of the Day CF convention). The portfolio was valued at the close Day 15 at 11,000,000. Manager 2 was able to deploy the entire new cash of 20,000,000 IMMEDIATELY at the beginning of Day 16 EXACTLY according to the weights the stocks had in the portfolio on the close of Day 15. The portfolio value at the end of the Day 30 stands at 33,818,182. The TWRR for Manager 2 would be as follows:
Sub-period 1 (Day 0 to Day 15): 11,000,000 ÷ 10,000,000 – 1 = 10.00%
Sub-period 2 (Day 16 to Day 15): 33,818,182 ÷ (11,000,000 + 20,000,000) – 1 = 9.09%
TWRR for Day 0 to Day 30: (1+10%) * (1+9.09%) – 1 = 20.00%
Manager 3: Started with the Initial Capital of 10,000,000 and there was a cash flow of 20,000,000 on Day 16 (assume Beginning of the Day CF convention). The portfolio was valued at the close Day 15 at 11,000,000. Manager 3 was able to deploy ONLY half of the new cash of 10,000,000 IMMEDIATELY at the beginning of Day 16 EXACTLY according to the weights the stocks had in the portfolio on the close of Day 15. The remaining 10,000,000 remained as the cash balance in the portfolio at the end of the close of Day 30.The portfolio value at the end of the Day 30 stands at 32,909,091. The TWRR for Manager 3 would be as follows:
Sub-period 1 (Day 0 to Day 15): 11,000,000 ÷ 10,000,000 – 1 = 10.00%
Sub-period 2 (Day 16 to Day 15): 32,909,091 ÷ (11,000,000 + 20,000,000) – 1 = 6.16%
TWRR for Day 0 to Day 30: (1+10%) * (1+6.16%) – 1 = 16.77%
My query: As we say TWRR is the return that removes the impact of cash flows, should not the performance of all the three managers be same?
In all the three cases above I have used TWRR return calculation methodology i.e. breaking the overall period into sub-period, striking valuation corresponding to cash flow dates, computing the sub-period returns and then linking the sub-period returns geometrically to find the overall period TWRR.
I am wondering then why the returns of Manager 3 are different from that of Manager 1 or 2 and how to explain this difference?
@Piyush: Why should manager 3 have the same TWRR as the others, if he sat on chunk of cash?
If the managers were invested in the exact same portfolio (with all of their available cash), then their TWRR’s should be identical. But this is not the case in your example.
Justin hi,
Another set of query from my side. Thanks for patience.
I downloaded and worked on the “CPM-Modified-Dietz-ROR-Calculator-2019.xlsx”.
1. Can you please confirm the calculator assumes end of the day cash flow convention?
2. Is this the general practice to consider end of the cash flow convention?
3. Can you please confirm the calculator computes the monthly Modified Dietz Rate of Return and then it links the monthly returns to compute the yearly Modified Dietz return?
4. Do you agree that returns computed as in Point 3 above (as done by the calculator) should be called “Monthly Modified Dietz Return” which is also called as ‘Approximation to Time Weighted Rate of Return”?
@Piyush Ranjan Singh:
1. The calculator assumes end of day cash flow convention.
2. Not sure – I don’t think it makes a big difference either way.
3. The calculator computes the monthly Modified Dietz Rate of Return and then it links the monthly returns to compute the yearly Modified Dietz return.
4. “Approximate Time-Weighted Rate of Return or “Linked Modified Dietz Rate of Return” would also be appropriate.
Hi Justin,
I read your white paper “Understanding your portfolio’s rate of return”. The underlying portfolio that has been considered here is an index fund and the last sentence of the 7th paragraph on page 3 reads: “We ignore fees and assume the fund tracks the index perfectly”.
My understanding from this assumption, for the case of Investor 1, the investor who contributed $25,000 on September 15, 2014 is:
(i) There was no transaction cost involved in the rebalancing the portfolio, and
(ii) Theoretically the manager was able to invest (allocate) the ENTIRE amount of $25,000 amongst the constituents of the MSCI Canada IMI Index on the beginning of the day EXACTLY in the same weight as the weights that the constituents stocks of the index had on the close of one day prior to the day of contribution i.e. on the close of September 14, 2014.
If my understanding above is correct, can we say that for the second statement as per para 4 on page 6 “…… TWRR is not affected by contributions and withdrawals” to hold true, there is an implicit assumption that in TWRR computation the contribution are assumed to have been invested in the underlying stocks of the portfolio EXACTLY in the same ratio as the ratio that the stocks had in the portfolio IMMEDIATELY prior to the contribution and without any significant / minimal trading cost, so that the even the new funds (contribution) attains the same rate of returns what the portfolio would have achieved, had there been no contribution?
If my understanding above is correct, I believe these assumptions become more relevant and important factor to be considered for a portfolio that is managed using an active small cap strategy from a developing market (a relatively shallower market) where:
(i) the manager may or not be able to rebalance the portfolio in the same ratio as prior to the contribution,
(ii) there could be a noticeable transaction cost owing to huge bid-ask spread in relatively less liquid names
(iii) it may take some time for the manager to deploy the additional funds completely
@Piyush Ranjan Singh: The assumption is that the $25,000 contribution goes into the portfolio at the end of the day (September 15, 2014) and is reinvested at the closing prices (so you can think of the example as purchasing the constituents of the MSCI Canada IMI Index in their market cap weights at 3:59 PM on September 15, 2014).
The costs of any active strategy should penalize the investor in the form of a lower rate of return, but perhaps comparing an active small cap strategy from a developing market to a passive ETF small cap strategy from the same market would be more appropriate than using an index (but this is just a question of which benchmark is most appropriate, not about the rate of return methodology).
J Hay invested $10000 on 1st January with x funds. During the 6months the fund had capital gains of $1000. On July 1st the fund paid a $200 dividend, which he immediately invested. On July 1st he invested another $5000. The fund value at the end of the year is$16000 and a dividend of $200 is paid. Calculate the time weighted rate of return
@Edith: I’m not doing your finance homework for you ;)
Hi Justin.
Just to use Edith’s example above. How are dividend payments supposed to be treated if they are not reinvested, are they supposed to be deducted from end values or simply ignored?
@RussellT: Dividends paid to cash will form part of the cash allocation of a portfolio (and will be included in the total portfolio market value figure), so they do not need to be entered separately (their value is already accounted for in the market value).
Dear Justin,
How to calculate gains (in dollars) from Time-weighted Rate Return (TWRR) ?
For example, Mr.X begins the year with $16,500,000 in his brokerage account. He makes 4 withdrawals from his account (so, there’re 5 subperiods exist). He calculated the total return for each subperiod and chain linking (multiply them) to get the TWRR (for instance, it is 1.4443 %).
Now he want to know how to convert the TWRR (1.4443 %) into dollars.
Can he just multiply TWRR with his account value at the beginning of the year like this: 1.4443 % x $16,500,00 = $238,308.22, is this correct ?
@Gunawan: You would need more data (i.e. What were all the sub-period returns? What were the withdrawal amounts?). You also mention 1.4443% – did you mean 144.43%?
Your calculation at the end is assuming there are no withdrawals, and your return is 1,444.30% over the period.
Hi Justin,
Thank you for the excellent, detailed work on rates of return. My online brokerage gives me TWRRs and MWRRs for each account that my wife and I have (RRSPs, TFSAs, non-registered). How would you combine these rates of return to get the overall values for our portfolio? For TWRR, I was thinking you could break it into subperiods for every cash flow in any of the accounts, then weight the TWRR value for each account in each subperiod by the proportionate starting or ending value of the account to the overall portfolio value, then multiply the overall portfolio TWRR numbers together to get an annualized figure. The problem is that it would be a lot of extra work and you’d also need to know the account and portfolio values on the dates of all cash flows. I can’t think of any method that would work for MWRR rather than running the IRR calculation on the whole portfolio manually.
Sean: These individual account rates of return are essentially useless. You’ll unfortunately have to calculate your overall portfolio return manually:
https://www.canadianportfoliomanagerblog.com/calculators/
Thanks for the response! Are the rates given useless because there isn’t a good way to combine them into one number for the whole portfolio, or useless because they tend to be inaccurate?
@Sean: There isn’t an accurate way to combine them into one number for the whole portfolio (that I know of), but they may also be inaccurate (big financial institutions aren’t known for their attention to detail ;)
Sorry, posted early for some reason. Thank you very much for all of your excellent work on this. It’s been extremely helpful. My online brokerage provides both time-weighted and money-weighted rates of return by individual account. I would assume they’re fairly accurate (and certainly available with much less effort than manual approaches). However, I want to combine the rates of return for the individual accounts in order to gauge my overall performance and I’m not quite sure how. Assuming I have an annualized TWRR and MWRR for each account, how would I combine the individual TWRRs and MWRRs to get annualized amounts for my whole portfolio? Without cash flows in and out I think it would be easy; I would just do a weighted value based on the starting or ending value of the accounts for the year (both should yield the same amount). However, I’m not sure how to deal with cash flows in and out when combining the rates of return across multiple accounts. Thoughts?
Can someone tell me why TWRR is Time Weighted? Where is the weighing of time in this whole calculation?
@Piyush: The TWRR measures the growth of $1, assuming that it has been fully invested over the entire time period.
From investor perspective the TWRR rate of return is exaggerated. Whether investor gives money at one shot or at different dates, the return is always Saleable value less Invested money during a period. From Fund manager perspective it may helpful to show TWRR but that is not actual profit.
this method is kind of not right. In the original example, let’s say at the end of the year the portfolio is $300,000. Conceptually, after substracting the $25,000 deposit, the end value is $275,000… which mean, the portfolio return is only at most 10% = (275,000 – 250,000)/ 250,000. But using the method, i get 10.49%…which incorrectly amplify the return…
furthermore, if we include the deposit, the portfolio should return a bit better than $25000 total to achieve 10% because the additional capital in the middle of the period, should get more money for the 10%..
@muchlis wibowo: I’m having difficulty following your examples and argument. Either way, this blog and white paper is the correct way to calculate your time-weighted rate of return.
Hi Justin,
I manage a portfolio which has two fund managers. Any inflow that comes into the account is shared equally among the two fund managers. Each fund manager’s portfolio is valued on daily basis and the summation of each fund managers portfolio being the total portfolio value.
Please which of the returns calculators is appropriate for my fund considering the fact that inflows come in every month, withdrawals are also made periodically and measuring the performance of each fund manager.
Thank you.
@Jennie: The time-weighted rate of return (TWRR) would be the best method for comparing the performance of the two managers. Practically speaking, the Modified Dietz Rate of Return calculator would be your best option (or you would have to calculate the TWRR manually).
Please can you help with question below i am failing to work it
A Fund Manager started the year 2016 holding funds with a market value of $1 million. On 1 July he received $0.4 million additional funds from the trustees. At the end of the year, the market value of the fund was $1.6 million and the total dividend income received over the year was $50 000. This information, together with additional data, is shown in the table below.
Value Date Fund Value($’000) Funds Injected($’000) Dividends*($’000) Index Value($000) ($’000)
1 Jan 2016 1 000 – – 2 000
1 July 2016 930 400 20 1 840
1 Jan 2017 1 600 – 30 2 330
* Since last value date
i)Calculate the Fund return and the Index return on a comparable basis using the MWR method. Show all workings.
@tinotenda: I should probably not be completing your homework assignments for you ;)
Justin – Thanks again. I’ll have to give this a lot more study, including your 20-page “Understanding Your Portfolio’s Rate of Return.” Meanwhile, I can’t resist observing that anyone who would praise or blame the advisor without taking into account (in SOME way) his own contributions or withdrawals shouldn’t be let out of the house without adult supervision. I’ve been simply adding back my withdrawals and subtracting my additions when I do my month-end balance sheet. But clearly my method needs improvement.
Thanks, Justin. I appreciate your spending so much of your valuable time on answering all these inquiries, from me and so many others, so I will not be offended in the slightest if you don’t reply to this. But I still don’t understand. Forget portfolio management. If I start an investment account with $10,000, add $500,000 a month later, and 59 months after the $500,000 addition I check to see how I’m doing, I will have had $510,000 in the account for almost the entire five years, and I would evaluate MY OWN performance by noting what $510,000 had become, not $10,000. (I’d like to also account for the $10,000 for 1/60 of the period, but that’s a minor issue). So if that’s the way to evaluate my own investing expertise (or luck!), why not apply the same reasoning if a portfolio manager had handled everything from the beginning? Thanks again.
@Brian Casiday: Let’s look at it from this example (sorry, the examples with advisors are just easier to understand – but consider yourself the advisor if you would like). Suppose you give your advisor $10,000 on December 31, 2011, and they invest it. After one month, they have lost 20% of your investment (so it is now worth $8,000). Thinking that this may be a good buying opportunity, you give them $500,000 more to invest on January 31, 2012. For the next 11 months, your total portfolio increases by 31.25%, ending the 2012 year at $666,750 [($8,000 + $500,000) x 1.3125]. However, your time-weighted rate of return is only 5% [((1 + (-20%))*(1 + 31.25%) – 1] = 5%
For the next 4 years, you add no new funds, and your portfolio grows by 5% each year. End of 2013 = $700,087.50, End of 2014 = $735,091.87, End of 2015 = $771,846.46, End of 2016 = $810,438.78.
At the end of 2016, you calculate your annualized money-weighted rate of return (using my MWRR calculator), and it equals 8.16%. You compare this MWRR return to an appropriate weighted-average index return of 7%, and are extremely pleased with the results. However, your annualized time-weighted rate of return is only 5% – this figure is more appropriate for benchmarking purposes. In fact, if you would have matched the 7% time-weighted index return, you should have had a portfolio worth $890,620.34 at the end of 2016.
Are you going to be upset with your advisor’s results (or your own)?
I understand the confusion, as most investors give their advisor cash before a bull market, and love them afterwards (even if the advisor lagged the index by 3%). The same investor will give the advisor cash before a bear market, and hate them afterwards (even though the advisor matched the index return).
This topic is complicated, but until investors spend the time understanding it, they will continue to be led astray by the industry (why do you think the industry opted for a money-weighted rate of return instead of a time-weighted rate of return?)
Justin – Your TWRR examples are very clear, and I understand how withdrawing $25K or adding $25K both yield the same 9.79% result. However, my thick skull can’t figure how this is a useful measure of portfolio performance. Say that on Jan. 31 I make an initial deposit of $10,000 to open an investment account. On Feb. 28 I add $500,000. A few years later I do the TWRR calculation. If the calculation ignores the additional $500,000 and bases my (or the portfolio manager’s) performance on the initial $10,000, how is this useful? Also, why is it not relevant to consider time? If I invest $10,000 and it becomes $11,000 in a year, that’s good – a 10% return. But if it takes 10 years for the $10,00 to reach $11,000, that’s not so good. Many thanks for your educational postings.
@Brian Casiday: In your example, the portfolio manager had no control over the timing of your cash flows. What if you gave the portfolio manager $10,000 on January 31st to “see how he/she would do”, and withheld the other $500,000. After one month, the portfolio manager had earned you 20%, so you sent them the remaining $500,000. If markets went down after the large contribution had been made, that would not be the portfolio manager’s fault (well, it may have been, but we could gauge their performance by comparing it to a benchmark return, or to their peers’ performance).
If you are interested in how you actually performed when considering your market timing decisions, then a money-weighted rate of return may be more appropriate (but you can’t benchmark it to index returns that are calculated using the TWRR).
I think this answers says it all really.
Advisors love to pat themselves in the back and shrug off as much responsibility as possible by saying they don’t have control over the cash flows or the index has crashed and they only lost a fraction of that crash..
That may be true but at the end of the day what was the performance of the portfolio? Did you make money or lose money? The most realistic measure is the mwrr (or in excel xirr).
@Federico Lovat: As you stated, the best measure of calculating whether you made money or lost money is the MWRR (although you could also just add up your net contributions and see if they are less than the market value of your portfolio, if this is all that you are interested in). However, if you’re using an advisor, why would you give them credit for the timing of your cash flows (or penalize them because of them). The best way to gauge whether an advisor is doing their job is by using the TWRR and comparing it to a weighted-average collection of suitable index or ETF returns.
Hello Justin, thanks for the post! However, I’m still confused over return calculation. The TWRR method is used to calculate a portfolio return that is unrealized. This is a perfect method to track a fund’s return. However, as an individual investor, how can I combine both my realized and unrealized return as one?
@Dan: I’m not sure I understand your question. What are you trying to combine and calculate?
Hi Justin,
I believe that I need to use money weighted average. What I’m trying to say is the formula doesn’t take into account the sizing of the contributions, so you might have made 10% on one particular month, and then you add a sizable amount to the portfolio, the 10% is still “chain-linked” to the following months gains/losses without taking into the sizing.
https://www.steadyhand.com/forms/2013/12/18/an%20introduction%20to%20dollar-weighted%20returns.pdf
If you go to page4, the scenario they’ve given, it’s exactly the same issue I’m getting where using the time weighted average, I’m getting a big percentage performance when in fact, a small amount was made.
@George: If you chain-link monthly money-weighted rates of return (I call this the “linked money-weighted rate of return”) or monthly Modified Dietz rates of return (which is what I do with my online calculator), the overall return will start to approximate the time-weighted rate of return.
Hi Justin,
My previous post was probably too long for you to bother reading, but as I was saying in my previous post, the unrealised gains made month to month will be factored into the final % return when you liquidate your holdings using the time weighted. This will in effect skew the final percentage return as those gains/loss made during the period between when you bought and sold are no longer relevent.
@George: Your comment about “gains/loss made during the period between when you bought and sold are no longer relevant” is a bit confusing. Honestly, I’m unsure what you’re really asking or what you would like me to agree with.
Hi Justin,
Just revisiting my previous question, I’ll give you an actual example account that I’m using to show you the issue I’m experiencing with this formula. To summarize, this particular security that the account held made extraordinary gains for a number of months, then dramatically dropped within a month. Chain-linking all these months together over inflated their final portfolio value after they sold out because all those previous months were basically “unrealised gains”.
If you get a chance, are you able to work out the return on this portfolio using the information provided below? I’ve doubled check everything and I get a figure of 70%+ return, when in fact this account made just under 20%.
In my calculation, I’ve calcualted performance on a monthly basis and chain-linked the months all together
*Dates are in dd/mm/yyyy format
1st buy: 13,600 units, price: $0.22 Total consideration: $2992 date: 9/3/2016
2nd buy: 7,140 units, price: 0.4175, total consideration: $2980.95 date: 21/4/2016
3rd buy: 6,500 units, price = $0.46 total consideration: $2990.00 date: 21/4/2016
Sell all: 27,240 units, price $0.39, consideration: $10,623.60 date: 12/8/2016
secuirty prices:
9/3/2016: 0.2150
31/3/2016: 0.2550
1/4/2016: 0.2550
21/4/2016: 0.4500
2/5/2016: 0.3650
31/5/2016: 0.4650
1/6/2016: 0.5000
30/6/2016: 0.4950
1/7/2016: 0.5000
29/7/2016: 0.4700
1/8/2016: 0.4750
12/8/2016: 0.4100
@George: This experience is fairly common. The time-weighted rate of return is useful if you are benchmarking the actual return of the stock (it is basically measuring the return of $1 invested in the stock at the beginning of the period).
In your case, you want to calculate a return that makes more sense to you personally (since you had the misfortune to invest the largest part of your cash prior to dismal returns for the stock) – you would need to calculate the money-weighted rate of return, if this is your objective. All of these points are covered in our white paper: https://www.canadianportfoliomanagerblog.com/wp-content/uploads/2014/09/2015-07-10_PWL_Bender-Bortolotti_Understanding-your-portfolio-s-rate-of-return_Hyperlinked.pdf?850eac
Hi Justin,
I have read your article with lots ofinterest and together with your insightful replies to the comments, I have a much clearer understanding of TWRR. I was hoping that you could help make one clarification for me. For a portfolio that holds Equity Securities (one illiquid counter only really) and cash:
BMV is USD 107 (Security MV 107 + Cash 0)
Dividend is paid out in cash and received same day Security goes ex dividend
EMV of the portfolio is USD 107 (Security MV 100 + Cash 7)
Will this portfolio have generated 0% portfolio Returns?
Will this security have generated 0% Equity Asset Class Returns?
I would appreciate this clarification or how to adjust my calculation because I would be expecting 7% return for both. Many thanks.
Lawrence
@Lawrence: You are correct that the portfolio returns (and the equity asset class returns) would be 0% (a 7% cash distribution is not the same thing as a 7% total return). If you are calculating the rate of return in Canadian dollars, you would also be required to make some currency adjustments.
Hi Justin,
The reason they are different in my calculations as for each month, I’m using the 1st and end of month closing prices.
@George: Ignore any 1st of the month values. A March 31st month-end value should also be the figure used for your April 1st value.
When calculating monthly rates of return, just use the last day of each month for portfolio market values.
I think what I need to use is the money-weighted approach
@George: If there were no contributions or withdrawals to or from the portfolio, you money-weighted rate of return = your Modified Dietz rate of return = your time-weighted rate of return. This is not an issue with your methodology, but rather your inputs.
Sorry that was a typo, it should be 6 months.
I’ll put an example to make it clearer.
Let’s say he bought prior to this period with a total MV of $50,000
1st month: Start: $50,000 End: $60,000
2nd month: Start: $62,000 End: $80,000
3rd month: Start: $82,000 End: $88,000
4th month: $90,000 End: $100,000
5th month: $100,000 End: $70,000
6th month: $70,0000 End: $60,000 <- At this point, portfolio is sold off
Using the calculations:
1st month: (60-50)/50 = 20%
2nd month: (80-62)/62 = 29%
3rd month: (88-82)/82 7.3%
4th month: (100-90)/90 = 11.11%
5th month: (70-100)/100 = -30%
6th month: (60-70)/70 = -14%
Geometrically linking them = 11.11%
The portfolio started at 50k and ended 60k. If you perform a single calculation (60-50)/50, you get 20%. In this example, it's actually understated the performance. The portfolio I was testing with overstated the performance.
@George: Some of your month-end values are different than the next month’s beginning values – in some cases they are off by $2,000 (which doesn’t make sense, as they should be identical). If you fix these errors, the geometrically linked monthly returns will equal 20%.
I’ve come across an issue that I’m not sure about
For simplistic calculation, let’s say we’ve got a portfolio holding just one single security and we’re calculating performance for each month
Let’s say for the first 4 months, the security continued to make high percentage gains. In the 5th and 6th month, the stock dropped significantly but still at a higher price than the initial cost price. At this point in time, the stock is sold off.
The issue is when I geometrically link all these months together (5 months). The final figure is that they’ve made a significant profit. In reality, the figure should be the difference between the initial buy market value and right before the sell market value as the months in between were “unrealised”.
@George: Are you using the market value at the end of the sixth month to calculate your total return? (you mention 5 months, but you need to include 6 months of returns).
correction: programmatically, not grammatically
Thanks Justin. I’ve just used your formula grammatically for calculating it on a security level and the end result is what I expect. However, the challenge is calculating it on a portfolio level. I attempted to chain-link the security % returns together but obviously that isn’t right.
@George: All month-end account values (securities + cash) must be manually added together, and then entered into the Modified Dietz calculator as a single total portfolio month-end figure.
What if there has been multiple cash movements through the month? Would you calculate the before and after values for each range?
i.e:
1st 10th 15th 20th
Buy buy buy sell
@George: You are correct – you would need to calculate the before and after values of each range, and then calculate the holding period returns during those times frames (chain-linking the returns together afterwards).
This is why most investors don’t calculate a true time-weighted rate of return – they would need access to daily portfolio valuation figures. If the cash movements are relatively small (compared to the portfolio size), the Modified Dietz return is probably close enough for most purposes.
Hi Justin, I think the formula above misses one very important element: the exponent/power. In examples of investment 1 and investment 2, the product of [(1+r1)*(1+r2)] has to be raised to the power of (1/N). In our examples, N=2 (2 time periods). So the TWRR = [1.0979^0.5] – 1 = 1.0478 – 1 = 4.78%. Hope it helps.
@Chuck: The formula above is correct. If you are trying to annualize a rate of return for a period longer than one year, then you would have to adjust the formula. Since our measurement period in the example is one year, there is no need to do so.
For a tutorial on how to annualize a rate of return (the measurement period should be longer than a year), please refer to this post: https://www.canadianportfoliomanagerblog.com/how-to-calculate-your-average-annual-rate-of-return/
Dear Mr.Justin,
What if there are irregular contributions and withdrawals present in a portfolio. How do we calculate TWRR?
Do we calculate weighting factor for each contribution and withdrawals?
or Can we calculate without the Weighting factor?
Dear Mr.Justin,
If there are irregular contributions and withdrawals present in a client’s portfolio, How do we calculate the TWRR?
Do we calculate the Weighting Factor factor for each month? or can we calculate without the weignting factor?
@Thananjeyan: The TWRR calculation requires daily portfolio valuations – if you only have month-end values available, the Modified Dietz Method would be more appropriate: https://www.canadianportfoliomanagerblog.com/how-to-calculate-your-modified-dietz-rate-of-return/
I also have posted a Modified Dietz calculator that should help: https://www.canadianportfoliomanagerblog.com/calculators/
Hi Justin,
Could we apply this TWRR on a security level within the portfolio? ie I would like to know the compounded return of the security.
Could we still use the geometric return of the security’s daily return % over the period to determine it’s compounded return?
And the summation of all the securities’ geometric return will = Portfolio’s TWRR?
@Li – you can definitely apply the TWRR on a security level (this is normally how individual stock returns are calculated). Dividends are usually assumed to be reinvested on the ex-dividend date.
Summing the securities’ geometric return will not equal the Portfolio’s TWRR (mainly because you would have to weight the securities return by their allocation within the portfolio).
Hi Justin, Thank you for the reply and confirmation of understanding.
If we are not able to sum each securities’ geometric return, is there a way to cross check the portfolio TWRR number?
I am trying to find a cross check function. ie performing TWRR on the portfolio NAV will produce the same return when I sum each securities’ geometric return over the same period.
Hi Justin,
I am looking for an indicator (I am not sure if it does exist to be honest).
The one you describe here looks close but I would like to have your opinion :
Let’s say I have an existing portfolio with three assets, for which I have predictible futur cash-flows and valuation (assumptions). I would like to know, based on the Rate of Return that I am looking for, which one I need to sell today if I needed to.
Do you think the TWRR can apply ? Many thanks in advance
Sincerely,
F. Guemara
@fguemara – calculating your portfolio’s TWRR unfortunately does not give any useful information on whether you should sell a certain security.
Dear Sir,
I have 2 questions:
1) In de formula to calculate the TWRR, where is the Time Weighting factor ?
All returns of the sub-periods have the same weight in the calculation …
2) I agree that the TWRR is useful in case of comparaison ( i.e. between Portfolio’s managers or with Benchmarks ) because this method focuses on the result of the managers but is it the best method to measure the performance of a single portfolio?
The TWRR doesn’t take into account the amounts in portfolio. For the TWRR, there is no difference if the return of a sub period is obtained on 5 USD, 50.000 USD or 5.000.000 USD …
The return of sub periods with just a little money in portfolio are considered to have the same weight in the results.
Example : New portfolio – Management Begin Date : 15/09/2015 – Cash Transfert/ Investment of 50.000 USD on 16/O9 – but for some technical reasons, the Security Transferts / investments ( 5.000.000 USD ) only start on 15/12/2015 ( delay not foreseen ).
Sincerely Yours,
ph. Mouffe
Hi ph. Mouffe – I’m not sure if I understand your first question about the “Time Weighting factor” – could you please explain?
Your second questions deals directly with why the TWRR may not accurately reflect how an investor’s portfolio has actually done – the Money Weighted Rate of Return may be more appropriate in this case: https://www.canadianportfoliomanagerblog.com/how-to-calculate-your-money-weighted-rate-of-return-mwrr/
Agree with Philippe Mouffe – where is the time-weighted factor in 1?
Dec 2013-September 2014 is about 290 days, so presumably there should be a 290/365 calc in the formula somewhere?
Good stuff. Re the daily tracking, while I completely agree in theory, I compute a time-weighted (and money-weighted) return for my portfolio on a monthly basis and find it to be “darn close enough” for average investor purposes. It can be especially close if your cash flows are (a) small relative to the size of the portfolio, and (b) can be timed to happen near the end of the month. Since in my personal case I can almost always guarantee those two to be true, I’m fairly sure computing this on a monthly basis is going to be accurate to within a few basis points. I made a spreadsheet that I just spend 20 mins at the end of every month entering a few market values, and it will calculate both this time-weighted and a dollar-weighted return for me.